FxNews—Litecoin has been in a bull market since August 8, at $45.5. The bullish trend eased when the price reached $67.5 on August 18. As of this writing, the LTC/USD pair tested the August 18 high ($67.5), trading at approximately $64.8.
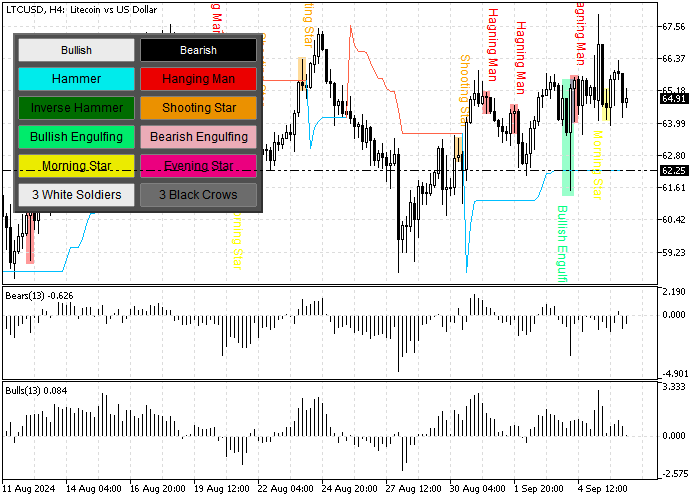
The LTC/USD 4-hour chart below demonstrates the price, support, resistance levels, and indicators used in today’s technical analysis.

Litecoin Technical Analysis – 6-September-2024
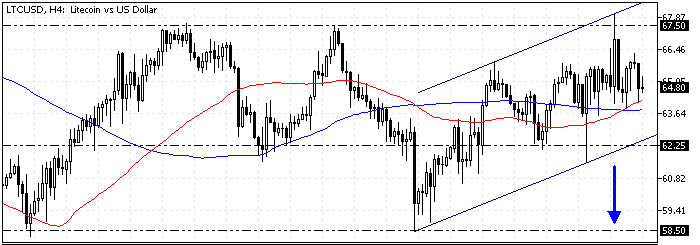
The 4-hour chart shows the cryptocurrency in discussion trades inside the bullish flag and above the 50- and 100-period simple moving average. This development in Litecoin price indicates that the pair is in a bull market.
The dip from the $67.5 resistance was expected because the stochastic oscillator was overbought. Currently, the indicator depicts 58 in value and decreasing, meaning the selling pressure is rising.
- The RSI 14 clings to the median line, which interprets as a low momentum market.
- The awesome oscillator signals divergence in its histogram, meaning the price could decline to the lower support levels or enter a consolidation phase.

As for the harmonic pattern, the 4-hour chart formed a bearish Gartley pattern with primary resistance at $67.5. This means the Litecoin price could dip.

Interestingly, we notice several hanging man candlestick patterns in the 4-hour chart, which indicate that bears are interested in pushing the price down. The super trend indicators play immediate support at $62.2.
Overall, the technical indicators in the LTC/USD 4-hour chart suggest the primary trend is bearish, but the price will likely decline.
Litecoin Price Forecast – 6-September-2024

The immediate resistance is in conjunction with the lower line of the bullish flag and the super trend indicator in the 4-hour chart at $62.2. From a technical standpoint, the price will likely decline to the August 28 low ($58.5) if the bears (sellers) close below the $62.2 mark.
If this scenario unfolds, the primary trend will reverse from bullish to bearish. Furthermore, if the selling pressure drives the price below $58.5, the next supply level will be the August 8 low ($54.5).
The primary resistance for the bearish scenario is $64.5. If this barrier is broken, the scenario should be invalidated accordingly
Litecoin Bullish Scenario – 6-September-2024

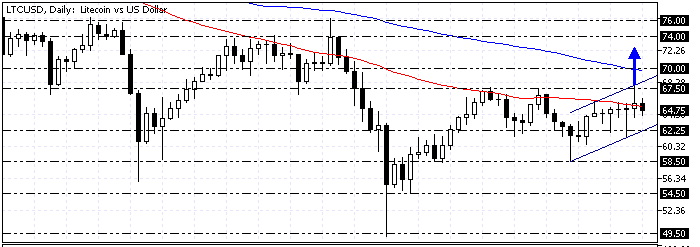
The critical resistance rests at $67.5. If the bulls or buyers cross and stabilize the price above it, the uptrend that began at $49.5 will likely extend to $70, the July 28 low.
If the buying pressure exceeds $70, the bulls’ path to the next barrier at $74 (July 22 High) will likely be paved. Please note that the 100-period simple moving average will support the bullish scenario if the price exceeds the $67.5 threshold.
Litecoin Support and Resistance Levels – 6-September-2024
Traders and investors should closely monitor the key levels below to make informed decisions and adjust their strategies accordingly as market conditions shift.
- Support: $62.2 / $58.5 / $54.5
- Resistance: $67.5 / $70.0 / $74.0
Disclaimer: This technical analysis is for informational purposes only. Past performance is not necessarily indicative of future results. Foreign exchange trading carries significant risks and may not be suitable for all investors. Always conduct your research before making any investment decisions.