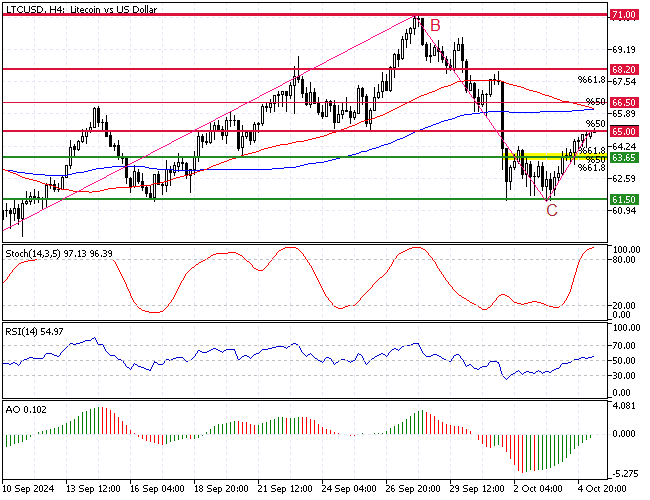
FxNews—Litecoin trades bullish from $61.5, where the C wave began. In today’s trading session, it tested the %50 Fibonacci retracement level of the AB leg as resistance at $65. Despite Litecoin’s recent gains, the primary trend should be considered bearish because the price is below the 50- and 100-period simple moving averages.
The LTC/USD 4-hour chart below demonstrates the price, support, resistance levels, and technical indicators utilized in today’s analysis.

Litecoin Technical Analysis – Bulls and the $63 Frontline Story
The Stochastic oscillator records 97 in the description, signaling the market is highly saturated from bulls’ bids. On the other hand, the RSI 14 and Awesome oscillator contradict the Stochastic signal.
- The relative strength index indicator shows a value of 55; the line hovers above the median, meaning the bull market strengthens.
- The Awesome oscillator flipped above the signal line, signaling that the bull market should resume.

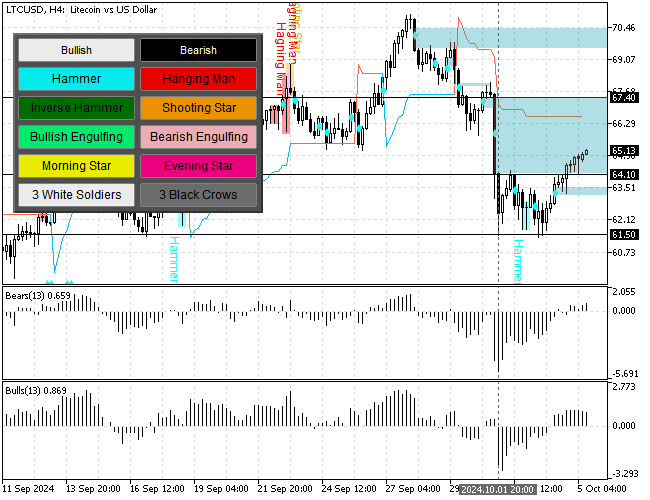
Notably, the Litecoin price entered a vital selling zone, which expanded in a large area between $64.1 and $67.4. This resistance area is the “fair value gap” that emerged after the LTC/USD rate dipped sharply on October 1. Hence, there is a high chance for the bullish wave to resume and ease when it reaches $67.4, the end of the fair value gap.
Overall, the technical indicators suggest the primary trend is bearish, but Litecoin’s bullish momentum from $61.5 should be taken seriously.
Litecoin Forecast – 5-October-2024

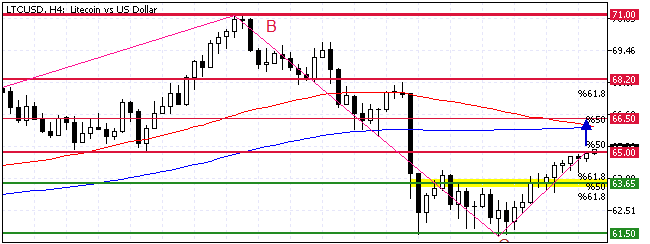
The %50 Fibonacci retracement of the AB leg at $65 is the immediate resistance to the current uptrend. From a technical perspective, if bulls can cross and stabilize the Litecoin price above $65.0, the uptrend from $61.5 will likely extend to the next resistance level at $66.5 (BC Leg’s %50 Fibonacci Retracement Level).
Notably, the $66.5 is backed by the 100-period simple moving average and the September 14 high, making it a robust resistance.
Please note the bullish scenario should be invalidated if the Litecoin price dips below the previous FVG (Fair Value Gap) at approximately $63.2.
Litecoin Bearish Scenario – 5-October-2024

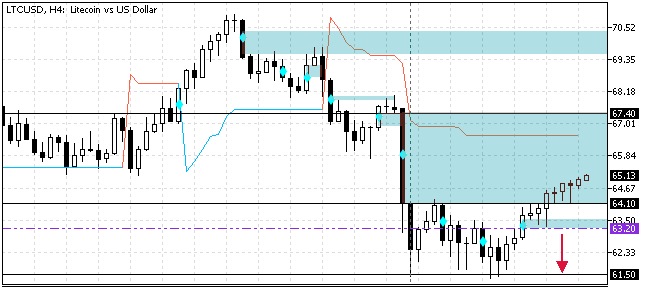
The immediate support rests at $63.2. If bears (sellers) push the LTC/USD conversion rate below this mark, a new bearish wave will likely emerge. If this scenario unfolds, the Litecoin price can potentially revisit the $61.5 (October 1 Low) resistance.
Furthermore, if the selling pressure causes the price to fall below the $61.5 mark, the bear’s path to the next support level at $59.0, September 2024 low, will likely be paved.
Litecoin Support and Resistance Levels – 5-October-2024
Traders and investors should closely monitor the key levels below to make informed decisions and adjust their strategies accordingly as market conditions shift.
- Support: $63.65 / $63.2 / $61.5 / $59
- Resistance: $65 / $66.5 / $68.2 / $71