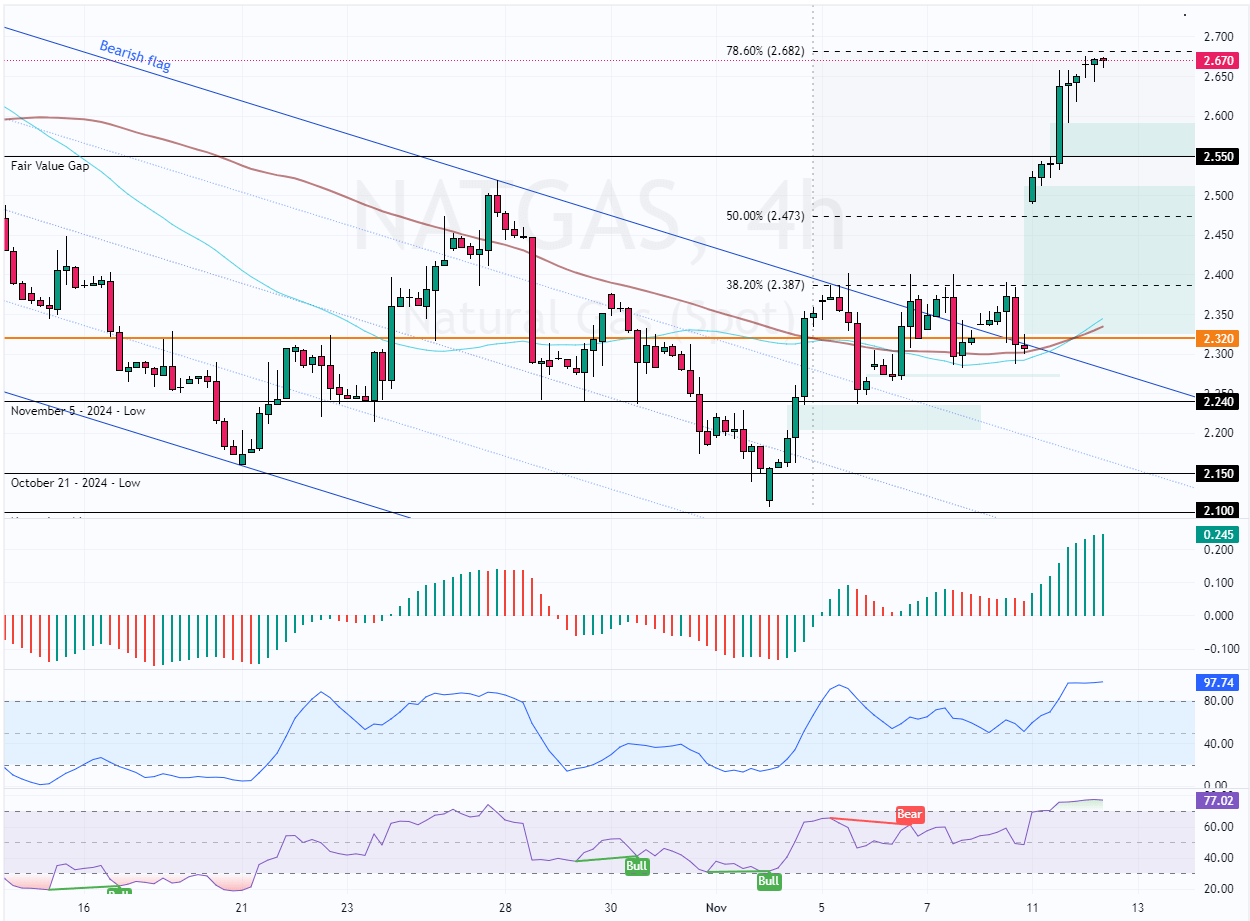
FxNews—In our previous NATGAS article (NATGAS Faces Major Resistance with Middle East Calm), we analyzed the market and stated that the 38.2 Fibonacci retracement level acted as immediate resistance, and the uptrend could resume if the prices exceed this level ($2.38).
That forecast came into play, and as of this writing, the U.S. natural gas trades at approximately $2.66, testing the 78.6% Fibonacci.
NATGAS Technical Analysis – 12-November-2024

The primary trend is bullish because the commodity in discussion trades above the 100-period simple moving average. However, NATGAS seems overpriced, as the Stochastic and RSI indicators hover overbought territory, depicting 97 and 75, respectively.
This development in the technical indicators suggests that a consolidation phase could be imminent, or a new bearish trend could emerge from this point.
NATGAS Price Forecast – 12-November -2024

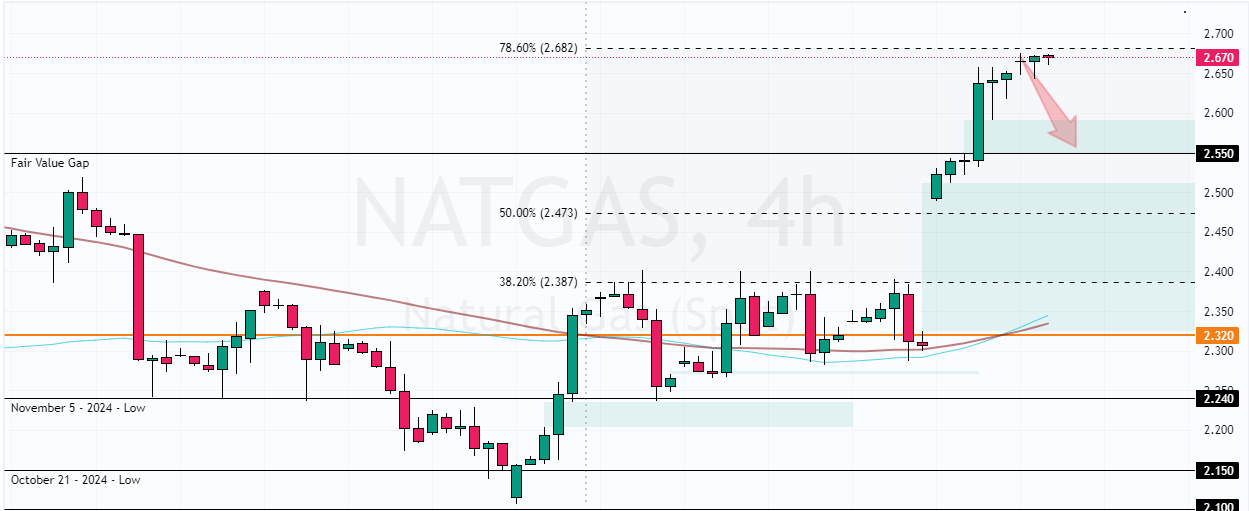
The 4-hour chart shows that the bulls formed a fair value gap area at $2.55, which is critical support. Due to the Stochastic and RSI’s overbought signal, natural gas is expected to dip and test this support area.
That said, this support has the potential to offer a decent bid to join the bull market. Hence, traders and investors should monitor the $2.55 mark for bullish signals, such as candlestick patterns.
Furthermore, if NATGAS bulls hold above $2.55, the next bullish target will likely be the October 2024 high at $2.84.
Conversely, the bullish outlook should be invalidated if NATGAS dips below $2.55.
- Support: 2.55 / 2.47 / 2.387
- Resistance: 2.68 / 2.84