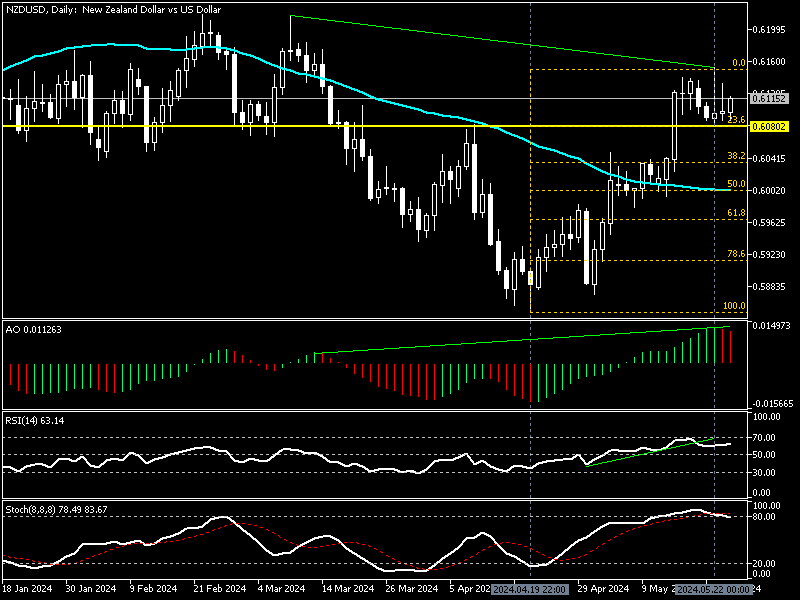
FxNews—The New Zealand dollar trades at about $0.611 against the U.S. Dollar in an uptrend, above the 23.6% Fibonacci retracement level at $0.608.
NZD/USD Technical Analysis Daily Chart

The daily chart above shows the awesome oscillator signals divergence. The last two bars changed their colors from green to red, recording 0.011 in the description. The divergence in the AO bars suggests the currency pair might step into a consolidation phase (the uptrend might weaken), or the market could reverse from a bull market to a bear market.
In addition to the awesome oscillator, a long-wick bearish candlestick pattern emerged on May 22 in the daily chart. This candlestick pattern aligns with the awesome oscillator divergence signal, suggesting that the NZD/USD‘s current uptrend might shift or lose momentum.
- The relative strength index (RSI 14) value is below 80, showing a value of 63 in its line. This signifies the uptrend is losing momentum.
- The stochastic oscillator %K line value is 78, returning from the overbought territory. This suggests that buying pressure eases, and the pair could reverse or consolidate.
These developments in the technical indicators in the daily chart, combined with the candlestick pattern, imply the uptrend that began on April 19 could reverse or step into a correction. This means the U.S. dollar will likely erase some of its losses against the New Zealand dollar in the upcoming trading sessions before the uptrend resumes.
NZD/USD Technical Analysis 4-Hour Chart

We zoom into the NZD/USD 4-hour chart to conduct a detailed analysis and find key levels and trading opportunities.
The chart above demonstrates the NZD/USD over 4 hours. The price maintains its bullish momentum above EMA 50 and the ascending trendline. When the price of a trading asset is above EMA 50 (exponential moving average), it indicates the primary trend is bullish.
- The Awesome oscillator bars are small and close to the signal line, with a -0.0008 value indicating a low momentum uptrend.
- The Stochastic oscillator and RSI give the same signal, recording 43 and 54, respectively, telling us the uptrend acceleration is degrading.
This AO, RSI, and stochastic oscillator development in the 4-hour chart means the NZD/USD is in a bull market, but the bullish momentum is weakening. Therefore, the trend might reverse or dip to lower support levels from May’s high at $0.615.
NZDUSD Uptrend Faces Consolidation Threats

From a technical standpoint, NZDUSD is in a bull market. It is essential to plan trading strategies according to the mainstream, which is bullish. However, the daily and 4-hour charts show signs of a trend reversal or possible consolidation, which might result in the NZD/USD price dip.
That said, analysts at FxNews suggest waiting patiently for the market to step out of uncertainty.
Immediate support is the 23.6% Fibonacci support at 0.6080, which neighbored the Ichimoku Cloud, EMA 50, and the ascending trendline. This conjunction made this support level robust enough to impose a sideway trading range on the currency pair between the 0.608 support and the 0.6151 resistance since May 15.
Suppose the U.S. Dollar drags the New Zealand price below the $0.608 mark. In that case, the consolidation phase might resume near the lower support level at 38.2% Fibonacci retracement level at the $0.603 mark, followed by %50 Fibonacci at the $0.6 psychological level.
The Bullish Scenario

The idea of continuation in the bullish momentum without a deeper consolidation seems unlikely, but this is a forex, and anything can happen. Knowing that the forex market can surprise traders and investors, the uptrend revives if the bulls push the price above the immediate resistance at $0.6151.
If this scenario comes into play, the road to April’s all-time high of $0.621 will be paved.
NZD/USD Key Support and Resistance Levels
Traders and investors should closely monitor the NZD/USD key levels below to make informed decisions and adjust their strategies accordingly as market conditions shift.
- Support: 0.608, 0.603, 0.60
- Resistance: $0.615, 0.621