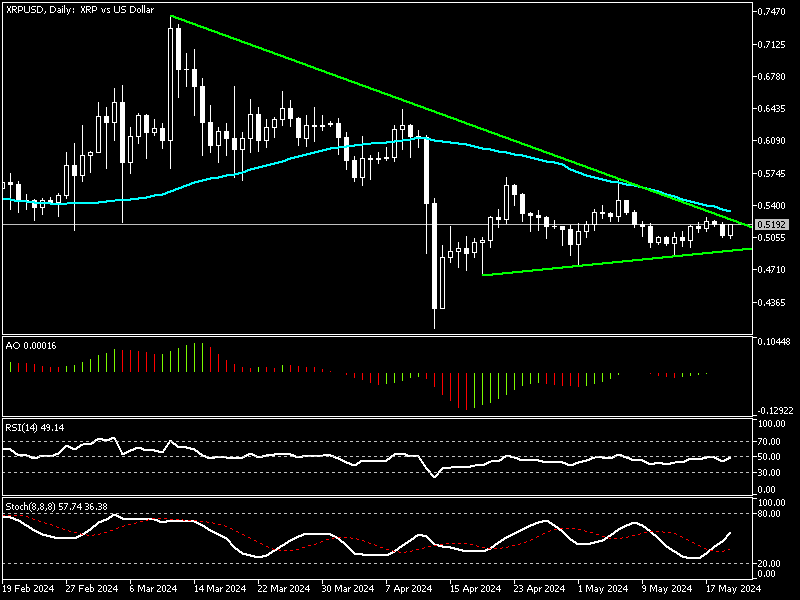
FxNews—Ripple ranges inside the symmetrical triangle; the crypto trades at about 0.51 against the U.S. Dollar. The XRP/USD daily chart below shows the price movement in the symmetrical triangle.

Ripple Technical Analysis – Symmetrical Triangle in Test
Ripple trades in a symmetrical triangle formed by two converging trendlines. The upper trendline descends from the recent highs, and the lower trendline ascends from the recent lows. The symmetrical triangle pattern in CFD trading is typically interpreted as a continuation pattern, where the security price is expected to break out in the direction of the primary trend once it approaches the triangle’s apex.
As depicted in the daily chart, the XRP/USD price is approaching the apex of the symmetrical triangle. Concurrently, the technical indicators give a neutral signal.
The awesome oscillator bars are small and close to the zero line. The RSI value is 49; only the stochastic shows some uptick in momentum.
These developments in the technical indicators suggest an uncertain and neutral market. Therefore, traders and investors should wait for the XRP/USD price to break out from one of the trendlines to confirm the next significant move.
XRP Bulls Need EMA 50 Break for 0.56 Target

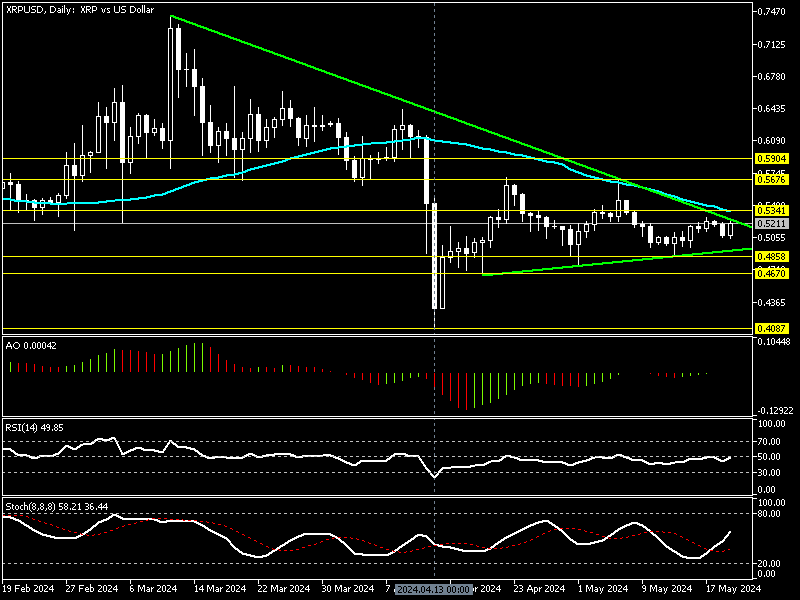
Immediate resistance is at 0.534, neighboring EMA 50. From a technical perspective, if the bulls cross and stabilize the price above EMA 50, the uptrend began on April 13 from 0.40 and could expand, with 0.567 as the next target, followed by 0.59 resistance. For this scenario to come into play, the XRP/USD price must maintain its position above the ascending trendline.
The Bearish Scenario
The immediate support is at 0.485. The bearish momentum will likely accelerate if the bears break below this level. In this scenario, the downtrend that began at 0.567 could dip further and retest the April all-time low at 0.408.
XRP/USD Key Support and Resistance Levels
Traders and investors should closely monitor the XRP/USD key levels below to make informed decisions and adjust their strategies accordingly as market conditions shift.
- Support: $0.48, $0.46, $0.40
- Resistance: $0.53, $0.56, $0.59