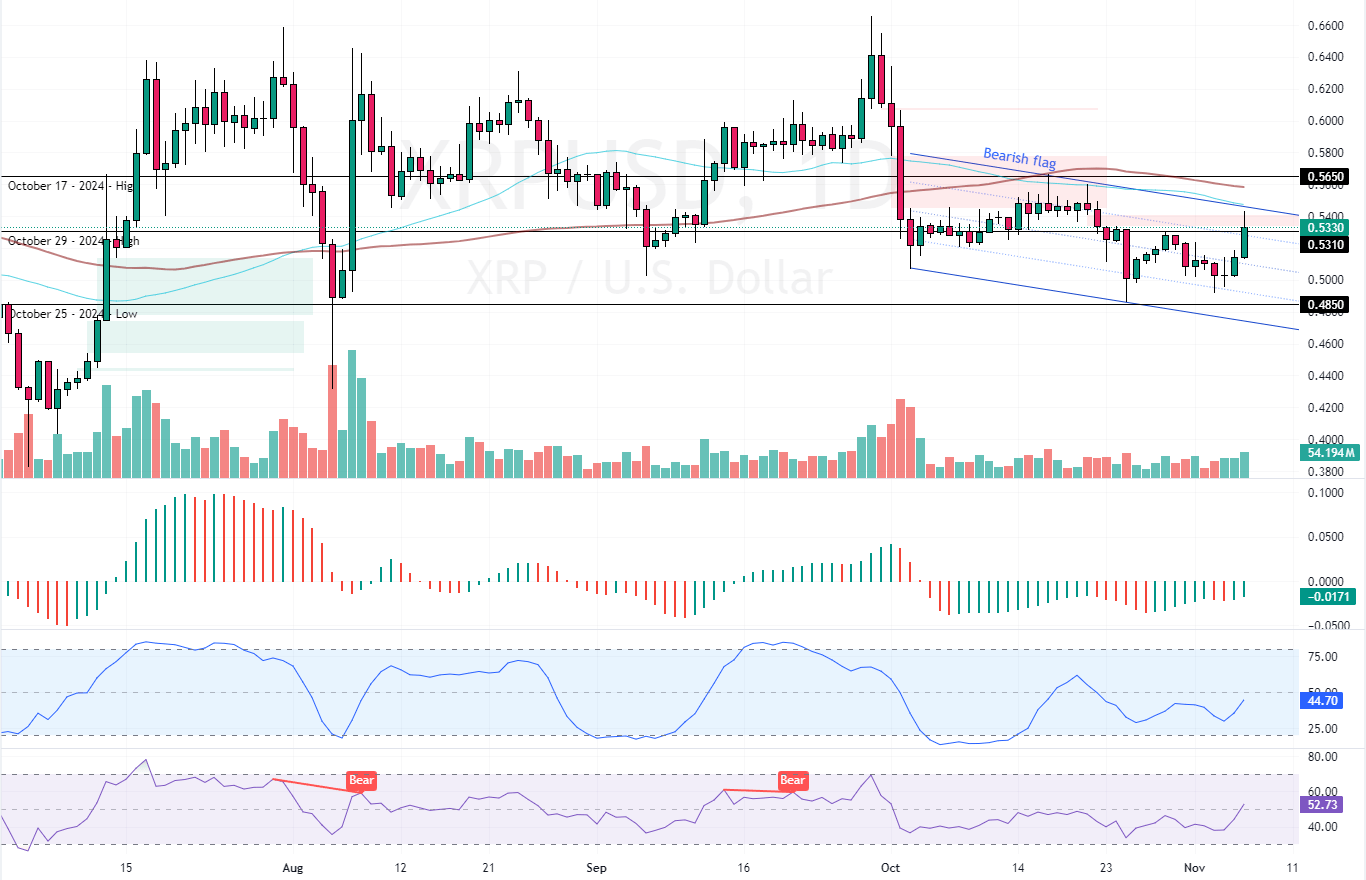
FxNews—Ripple gained 3.7% in today’s trading session, trading at approximately $0.533, testing the upper line of the bearish flag and the 50-period simple moving average.
The XRP daily chart below demonstrates the price, support, and resistance levels, as well as the technical indicators utilized in today’s analysis.

Ripple Technical Analysis – 6-November-2024
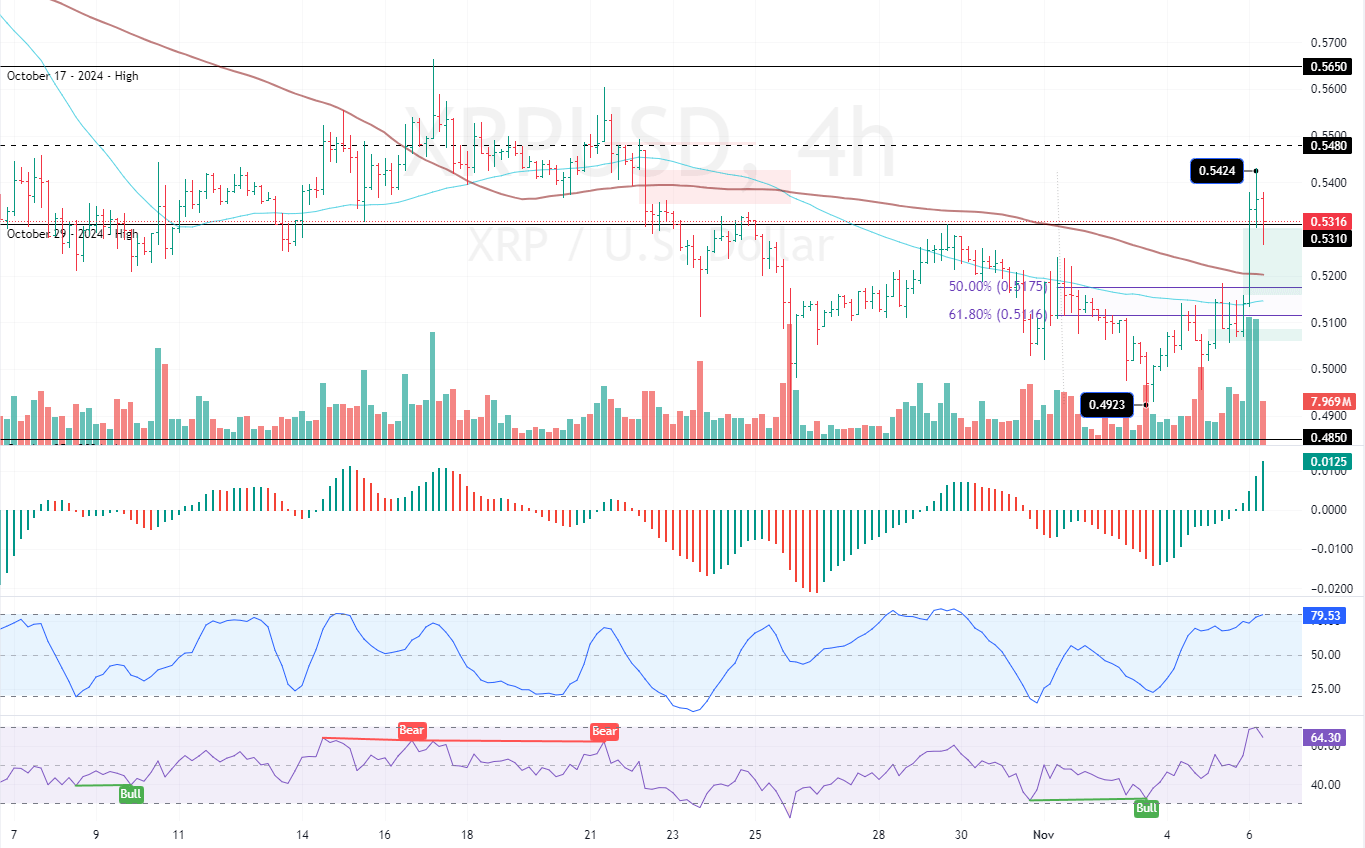
Zooming into the 4-hour chart, we notice today’s price jump created a bullish Fair Value Gap. Meanwhile, the Stochastic Oscillator is about to flip above 80, meaning Ripple could become overpriced soon. Additionally, the RSI 14 depicts 65 in the description, declining from the overbought territory.

Despite the oversold signals given by the momentum indicators, the XRP/USD conversion rate is yet above the 100-period simple moving average, making the primary trend bullish.
XRP Set to Test $0.517 Support Level Amid Overbought Conditions
The immediate support is the %50 Fibonacci retracement level at $0.517, backed by the 100-period SMA. Due to the overbought condition, the price has the potential to return and fill the FVG area near $0.517, followed by $0.511. But for this scenario to unfold, XRP/USD must stabilize below the immediate support, which is the October 29 low at $0.531.
Please note that the outlook for XRP’s trend is bullish as long as the price is above the 100-period SMA. That being said, the next bullish target could be the October 17 high at $0.565 after a minor consolidation near the above-mentioned support levels.
- Support: 0.517 / 0.611
- Resistance: 0.548 / 0.565


