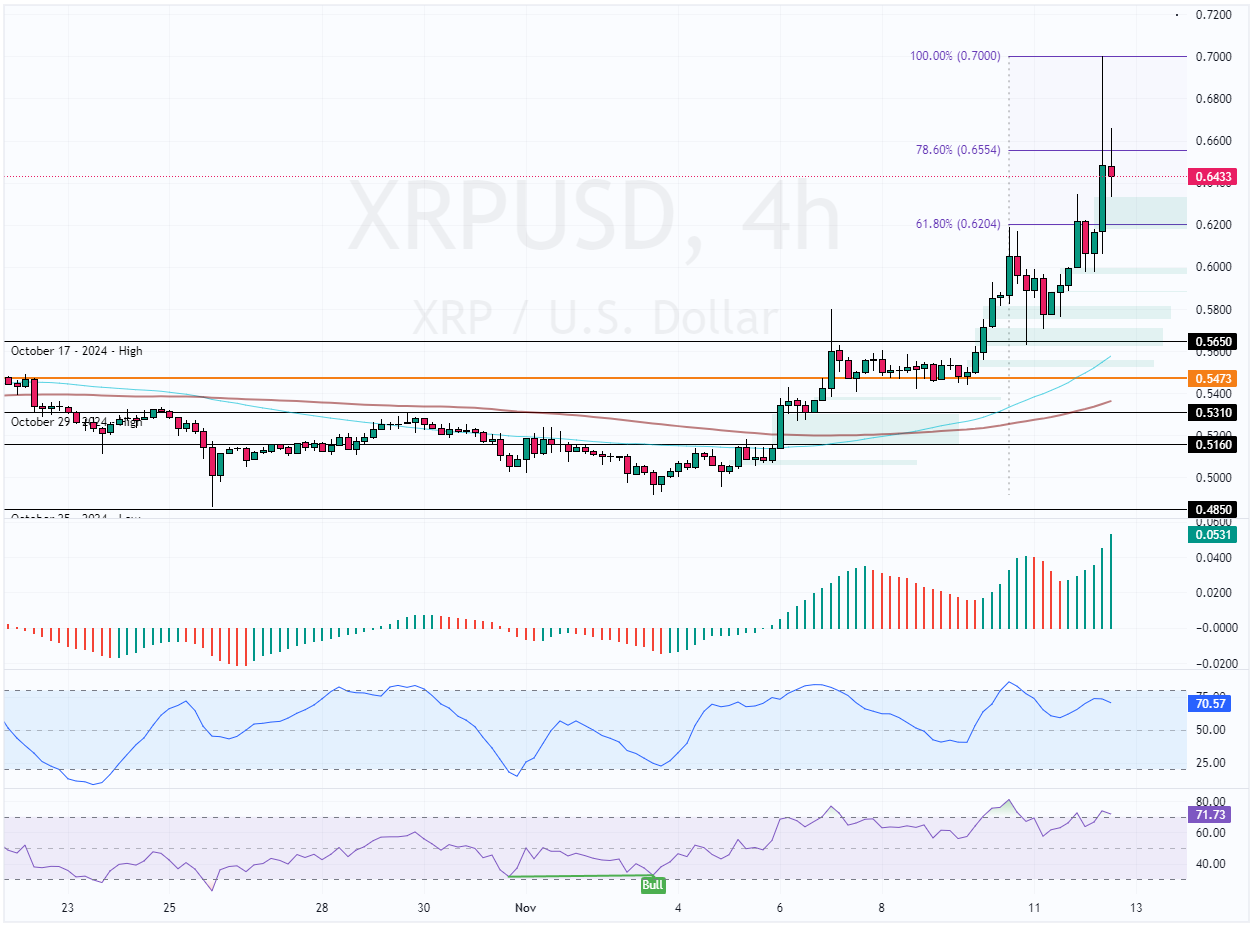
FxNews—Ripple started dipping from $0.70, as the RSI 14 overbought signal hinted. Despite today’s bearish momentum, XRP is up 3 percent from yesterday, holding above the 61.8% Fibonacci retracement level, backed by the bullish fair value gap.

Ripple (XRP)Technical Analysis
As of this writing, XRP/USD trades at approximately $0.644, correcting below the immediate resistance of 0.655, the 78.6 Fibonacci level. As for the technical indicators, the primary trend should be considered bullish because the price is above the 50- and 100-period simple moving average.
On the other hand, the relative strength index indicator declines from overbought territory, meaning the consolidation phase could resume. That said, the Ripple (XRP) price is anticipated to test the 61.8% Fibonacci at $0.62. It is worth mentioning that this level is strong support since it is backed by the Fair Value Gap.
Ripple (XRP) Price Forecast
Traders and investors should monitor the 0.620 support closely for bullish signals, such as candlestick patterns. From a technical perspective, the uptrend will likely resume if the 0.620 resistance holds.
Please note that the bullish outlook should be invalidated if XRP’s value falls below 0.620. If this scenario unfolds, a new bearish wave will likely form, which could extend to 0.565 support.
- Support: 0.620 / 0.60 / 0.58
- Resistance: 0.66 / 0.70