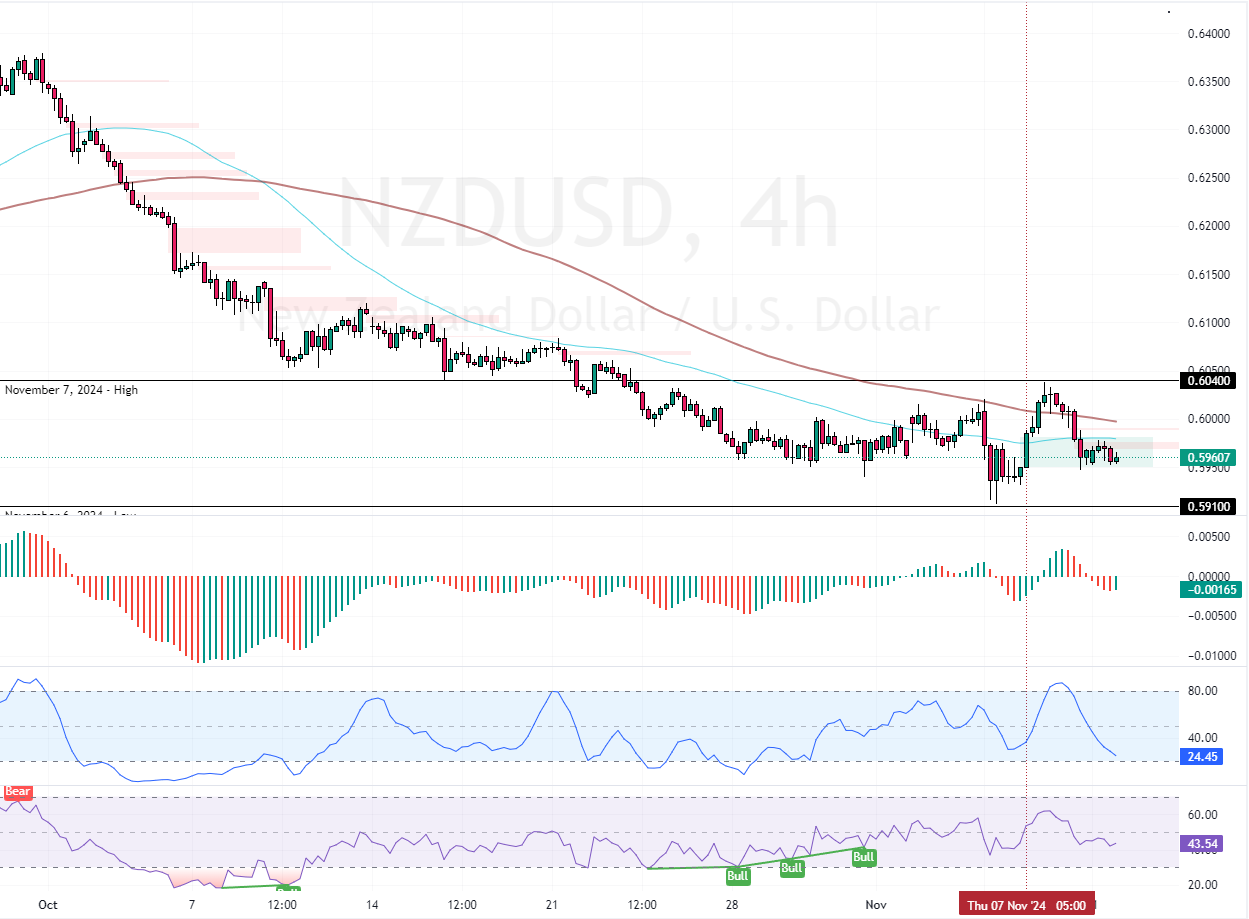
FxNews—The New Zealand dollar trades bearishly against the Greenback at approximately $0.596, below the 100-period simple moving average. As of this writing, the NZD/USD currency pair is testing the bullish Fair Value Gap that emerged on Thursday, November 7.
The 4-hour chart below demonstrates the price, support, and resistance levels, as well as the technical indicators utilized in today’s analysis.

NZDUSD Technical Analysis – 11-November-2024
The primary trend is bearish because the NZD/USD price is below the 50- and 100-period simple moving averages. Additionally, the RSI 14 and the Stochastic Oscillator are declining, depicting 43 and 24 in the description, which indicates that the market is not oversold and that the downtrend can potentially resume.
On the other hand, the recent green bar in the Awesome Oscillator’s histogram indicates that the bull market strengthened.
Overall, the technical indicators suggest the primary trend is bearish and should resume.
NZDUSD Forecast – 11-November-2024

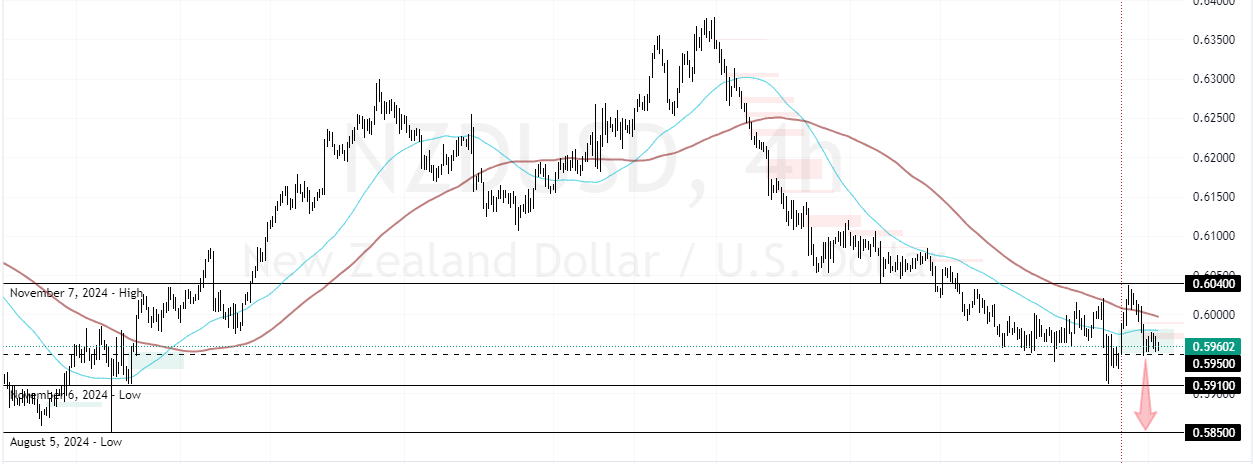
The October 8 low at $0.595 is the immediate support. If sellers push the NZD/USD price below this support, the downtrend will likely resume, with $0.591 as the next target.
Furthermore, if the selling pressure exceeds $0.591, the downtrend can potentially extend to the August 5 low of $0.585.
Please note that the bearish strategy should be invalidated if NZD/USD bulls pull the market above the $0.604 resistance.
- Support: 0.595 / 0.591
- Resistance: 0.604