FxNews—Today, silver prices climbed to $31 per ounce, halting a recent drop that had pushed the metal down to a one-month low of $30.1 on the same day. This uptick occurred because U.S. inflation rates matched expectations, leading investors to believe that the Federal Reserve will continue cutting interest rates in December.
Investors Watch as Rate Cut Lowers Silver Prices

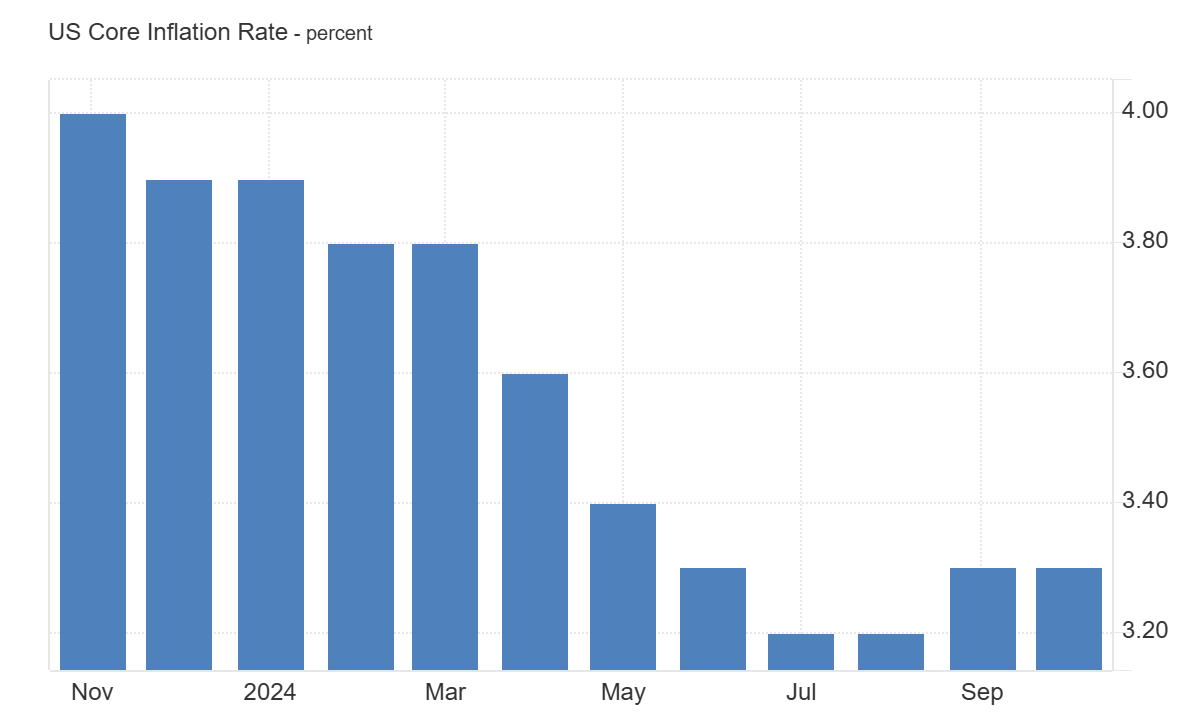
In October, overall inflation was reported at 2.6%, as predicted, and core inflation remained steady at 3.3%. Consequently, markets anticipate another 0.25% rate cut by the U.S. central bank in its final decision of the year. This expected rate reduction lowers the cost for investors to hold gold and Silver, which do not yield interest.
Silver Demand Dips as Solar Panel Supply Surges
However, the rise in silver prices was limited due to decreased industrial demand for the metal. Furthermore, the absence of new economic stimulus from the Chinese government suggests that an oversupply of solar panels—a major consumer of Silver—will persist.
Additionally, reports indicate that Chinese-owned solar panel companies are scaling back production because Trump’s election victory increases the likelihood of higher tariffs on their products.
Silver Technical Analysis – 13-November-2024

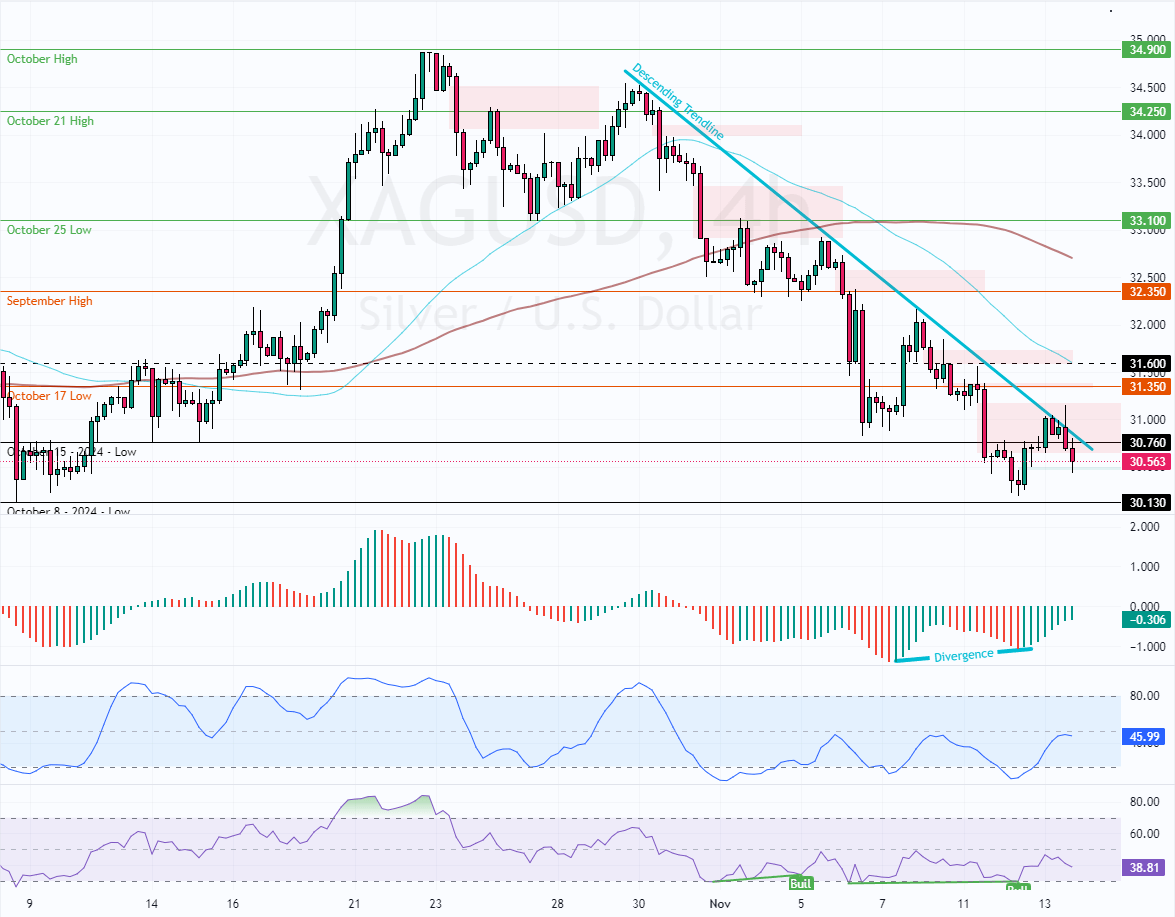
XAG/USD bulls failed to break above the descending trendline or the October 17 low at $31.35, a resistance area backed by the bearish Fair Value Gap. Despite Awesome Oscillator and RSI 14’s divergence signal, Silver prices began dipping again from $31, trading at approximately 30.5 as of this writing.
- Next analysis: Gold Plunge as ETFs Pour $809 Million in November
Silver Stays Bearish Below $31.0

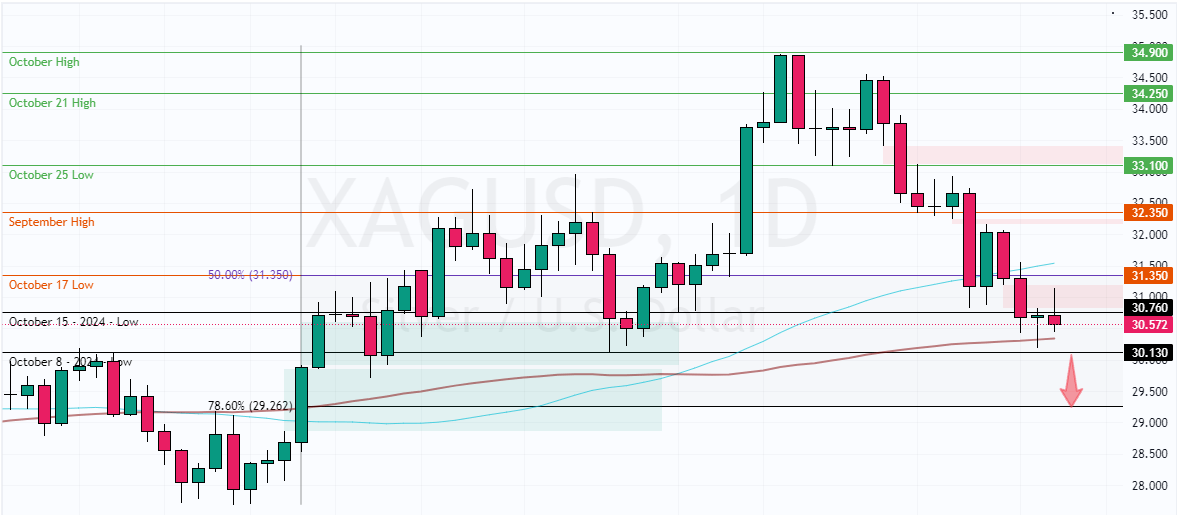
From a technical perspective, Silver’s trend direction remains bearish as long as the prices are below the 50-period simple moving average, the $31.35 mark, backed by the 50% Fibonacci retracement level.
That said, a new bearish wave will likely begin if XAG/USD falls below the 30.1 immediate support. In this scenario, the next sellers’ target could be the 78.6% Fibonacci retracement level at $29.2.
- Support: 30.13 / 29.2
- Resistance: 30.76 / 31.35