FxNews—In today’s trading session, the silver price crossed above the descending trendline and the 23.6% Fibonacci level. As of writing, the XAG/USD pair trades at about $31.7, rising toward May’s all-time high of $32.5.
Silver Technical Analysis – May-27-2024 (4-Hour Chart)
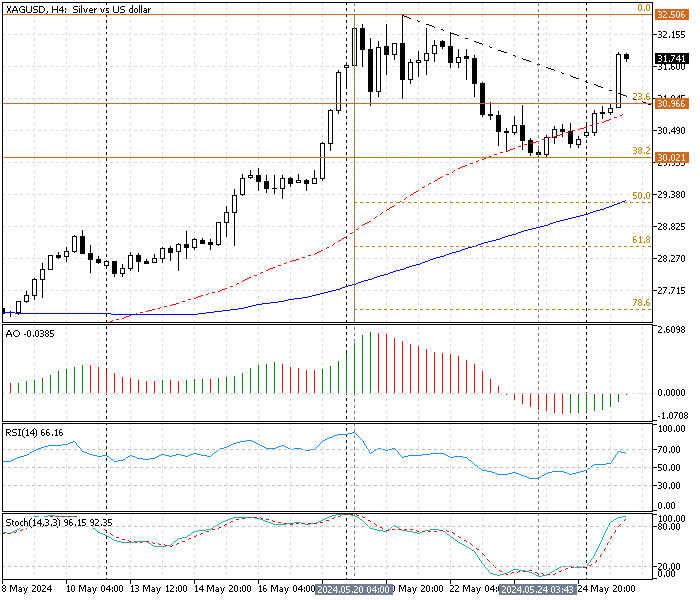
The 4-hour chart above shows the price broke out from the descending trendline with a long and full-body bullish candlestick pattern. This jump in the Silver price drove the Stochastic oscillator (14,3,3) into the overbought territory. This means the market has become overbought and would probably start a consolidation phase below the $32 threshold.
- The awesome oscillator bars are green and close to the signal line, depicting -0.03 in the description. This conveys the market is bullish. But, since the AO line is nearing zero, this indicates that a market might step into a correction phase despite the bullish momentum.
- The relative strength index shows a value of 66, approaching 70, but it still has room to become overbought. This means the Silver price might hover around today’s peak at $32 a bit longer, but a consolidation phase should be on the horizon.
These developments in the technical indicators in the 4-hour chart suggest the primary trend is bullish. Still, the market has become overbought after the breakout, and an imminent consolidation phase is on the horizon.
Silver Technical Analysis – May-27-2024 (1-hour chart)
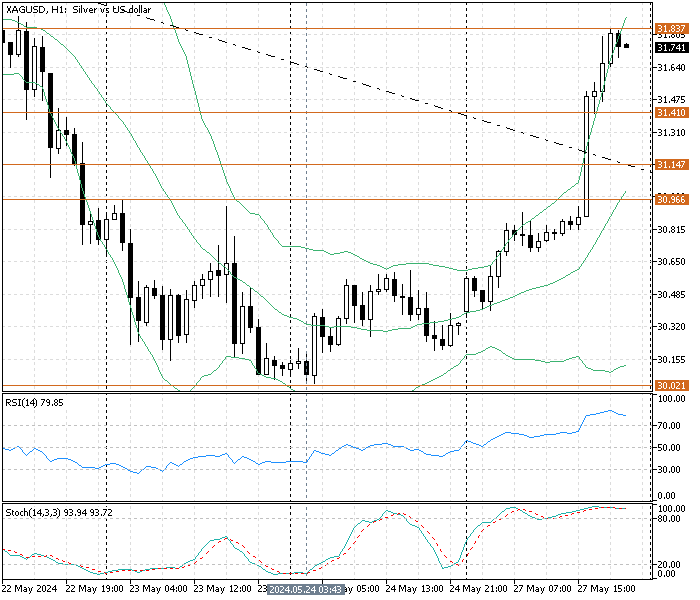
The Silver 1-hour chart offers more details of the overbought market. The RSI (14) value is 79 and has been hovering in the overbought territory for six consecutive trading hours. This increase in the RSI value indicates that a pullback from today’s high of approximately $32 could be imminent.
- The Stochastic oscillator aligns with the RSI, giving the same overbought signal. The %K line value is 93, floating in the overbought territory for most of today.
- The price of silver is above the upper band of Bollinger, signifying an overbought market.
These developments in the technical indicators in the 1-hour chart suggest consolidation is on the way.
Silver Price Soars by $1 in 4 Hours: What’s Next?
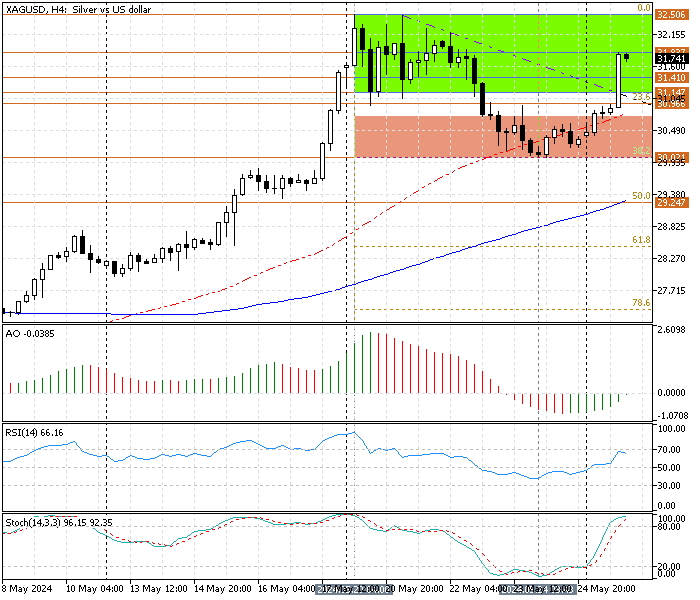
From a technical standpoint, the primary trend is bullish, with key support levels at $31.4 and $31.1. With the RSI and Stochastic signaling an overbought market and the fact that the silver price rose by $1 in 4 hours, it is recommended to wait for the market to erase some of its recent gains as a consolidation phase.
If this scenario comes into play, the silver price can dip to the immediate support at $31.4, followed by $31.1. These two support levels can provide a decent bid for traders and investors to join the bullish market gradually.
That said, if the price stays above SMA 50 in the 4-hour chart, the bullish trend will likely resume, and the initial target will be May’s 2020 high at $32.5.
The Bearish Scenario
The 23.6% Fibonacci level is the pivot point between the bull and bear markets. The bullish scenario should be invalidated if the Silver price dips below $30.9. In this scenario, the 38.2% Fibonacci at $30 would be tested again, and with more selling pressure, the next bearish target will be the 50% Fibonacci support level at $29.2.
Silver Key Support and Resistance Levels
Traders and investors should closely monitor the XAG/USD key levels below to make informed decisions and adjust their strategies accordingly as market conditions shift.
- Support: $31.4, $31.1, $30.9
- Resistance: $31.8, $32.5
Disclaimer: This technical analysis is for informational purposes only. Past performance is not necessarily indicative of future results. Foreign exchange trading carries significant risks and may not be suitable for all investors. Always conduct your research before making any investment decisions.

