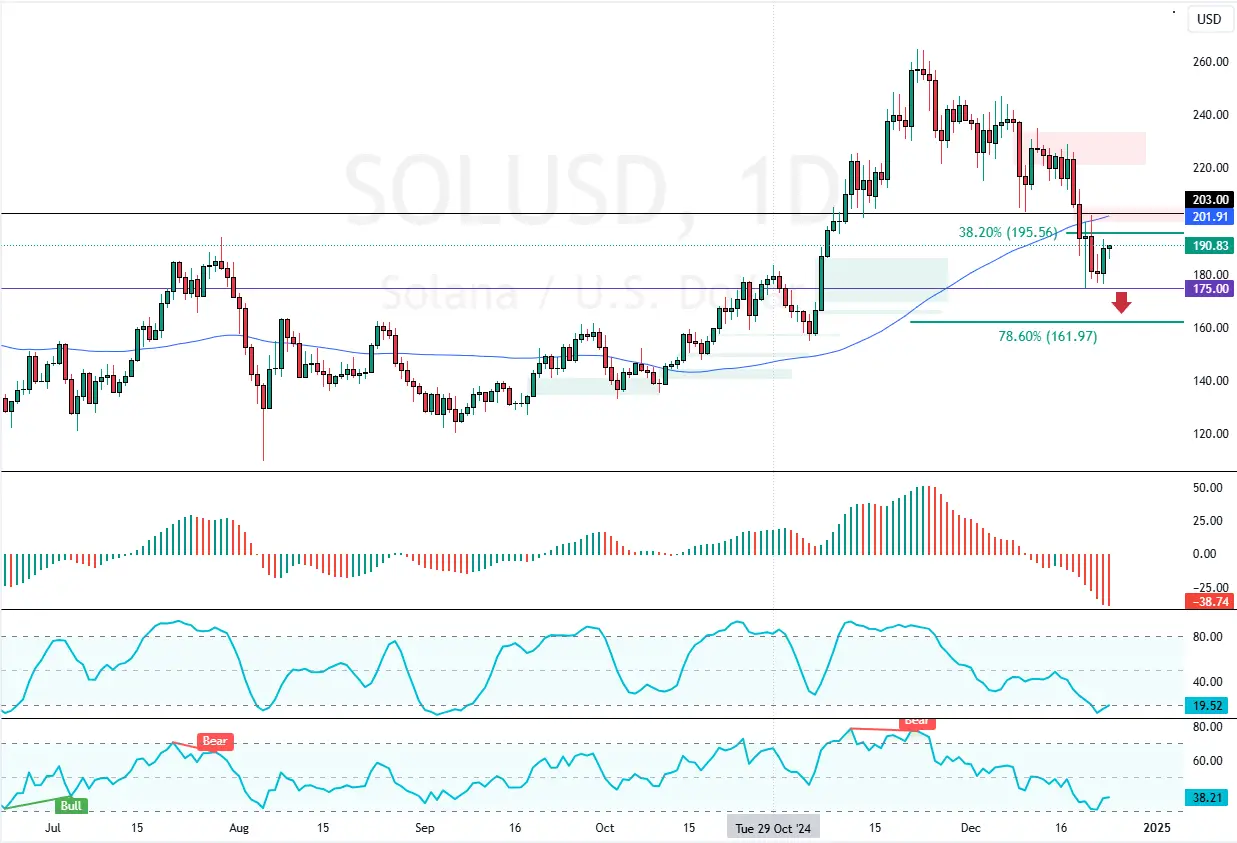
Solana trades at approximately $190 in a strong bearish market, below the 75-period SMA and the $203.0 resistance.
The next bearish wave hinges on the $175.0 support. A break below this level could result in further losses toward the 78.6% Fibonacci retracement level at $161.0.

Solana Technical Analysis – 24-December-2024
Solana’s primary trend should be considered bearish because the prices are below the $203.0 resistance, the descending trendline, and the 75-period simple moving average. However, the Awesome Oscillator histogram is green and nearing zero, meaning the uptick momentum from $175.0 could extend.
Additionally, the RSI 14 and Stochastic records show 50 and 66, respectively, which indicates that the market is not overbought and that bulls should be able to push prices higher.
Overall, the technical indicators suggest that while the primary trend is bearish, the consolidation phase could last longer before the downtrend resumes.
Solana Bears Could Break $175

The Friday 20 lowest prices at $175.0 is the immediate support. From a technical perspective, the downtrend could be triggered if Solana bears push the prices below this level.
If this scenario unfolds, the cryptocurrency could fall toward the 78.6% Fibonacci retracement level at $161.0.
- Good read: Ethereum To Target $3600 if $3210 Holds Firm
The Bullish Scenario
Please note that the bearish trend hinges on the $203.0 resistance. If bulls pull the prices above $203.0, the current consolidation phase could target the 75-period SMA at approximately $208.0.