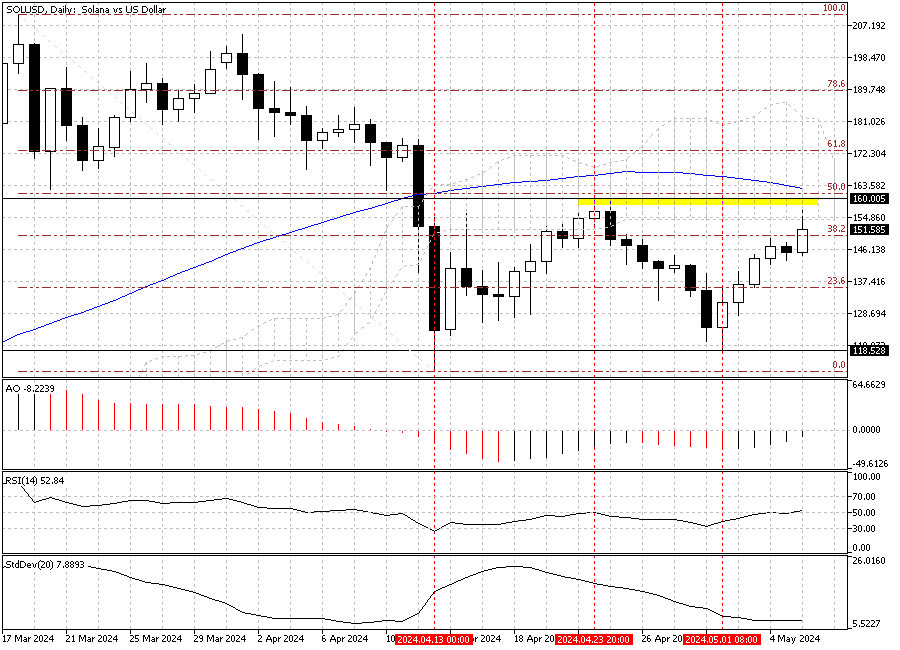
Solana is experiencing a pullback against the U.S. Dollar after the pair approached the March 23 high, and as of writing, the SOLUSD pair trades at about $150. The daily chart below shows the SOLUSD is forming a double top pattern in the daily chart.

SOLUSD 4-Hour Chart Technical Analysis

We zoomed into the SOLUSD 4-hour chart to find the key levels. The chart above reveals the SOLUSD pair trades above the Ichimoku cloud and EMA 50 and is testing the $150.0 minor resistance in today’s trading session. This level coincides with the %38.2 Fibonacci.
RSI Returns Indicate Market Cooling Off
The technical indicators are in line with the current bull market. The awesome oscillator bars are green, but the RSI indicator has just returned from the overbought area, which signals a consolidation phase might be on the horizon before the uptrend continues. The standard deviation backs up the RSI, with a hovering low at about 3.0, interpreted as the market trend slowing down.
Forecast: Solana Rallyes Toward $160 as Bulls Hold the Pivot
From a technical standpoint, Solana is in an uptrend as long as it trades above the pivot, the $145.0 mark. Therefore, if the bulls maintain the price above the pivot, the uptrend from $118 on the 1st of May will likely extend to April’s high, the $160.0 mark.
The April’s high is a strong barrier for the buyers. It is vital to note that it is not clear what would happen if the price reaches this demand zone. We suggest closely monitoring the $160 mark and waiting for the RSI signal and candlestick patterns.
What Happens if Solana Dips Below $145
The chart above shows the SOLUSD pair in a one-hour chart. The pivot is depicted in blue. Should the price dip below the pivot ($145.0), the bullish technical analysis should be invalidated. If this scenario comes into play, the price will likely decline to the next support level, around $140, which has support from EMA 50.
