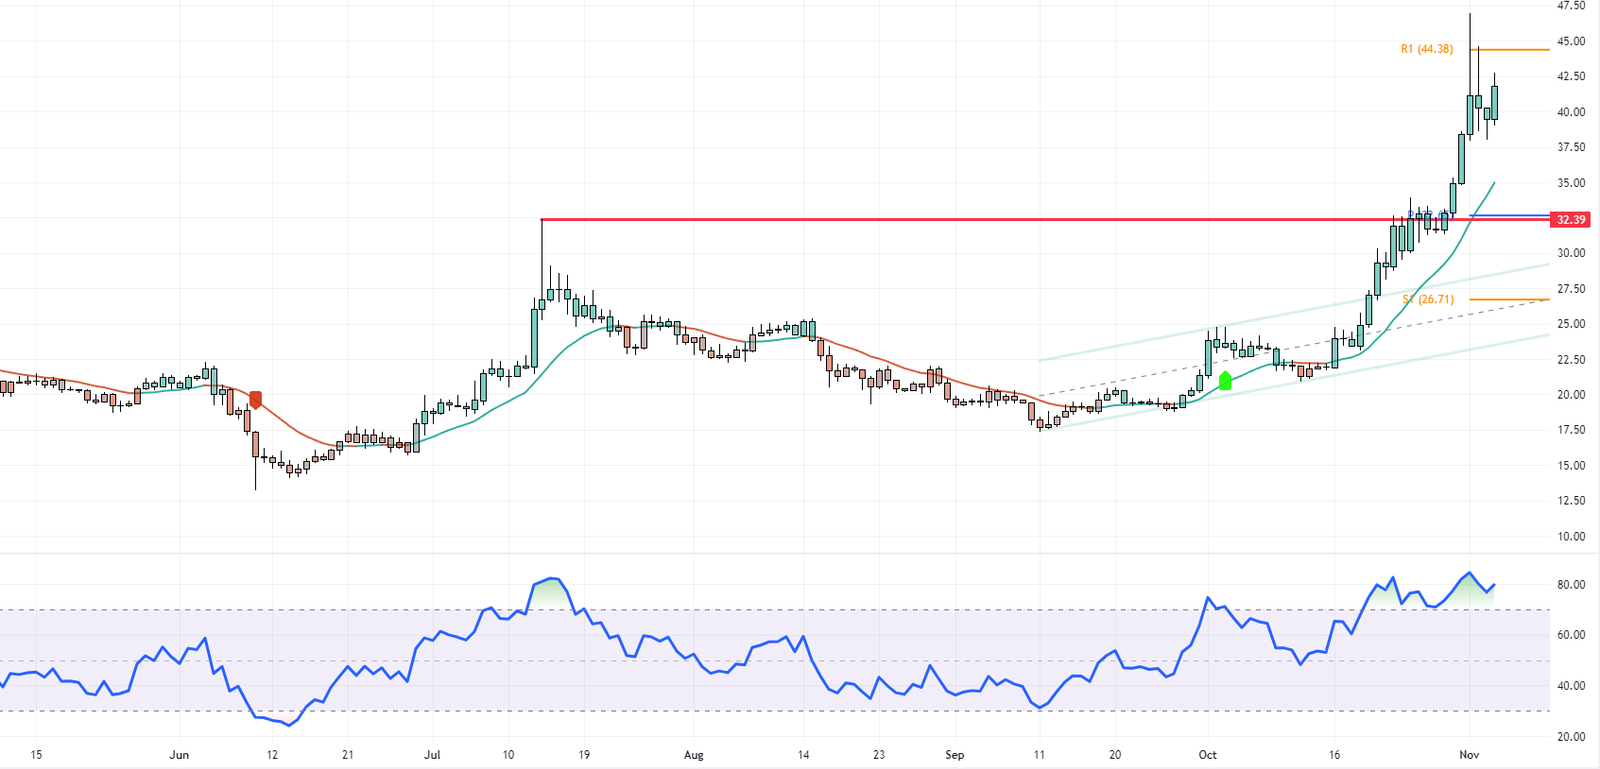
In October, Solana (SOLUSD) experienced a significant price surge, reaching a high of $47.5 before settling at $34.5. Currently, Solana is trading at around $42.5.
Our Solana Technical Analysis indicates that the RSI indicator has been overbought since October 20. Despite this overbought condition, SOLUSD hasn’t started correction yet, indicating a strong bullish bias and high volatility in the Solana market.
Solana Technical Analysis – A Comprehensive Overview

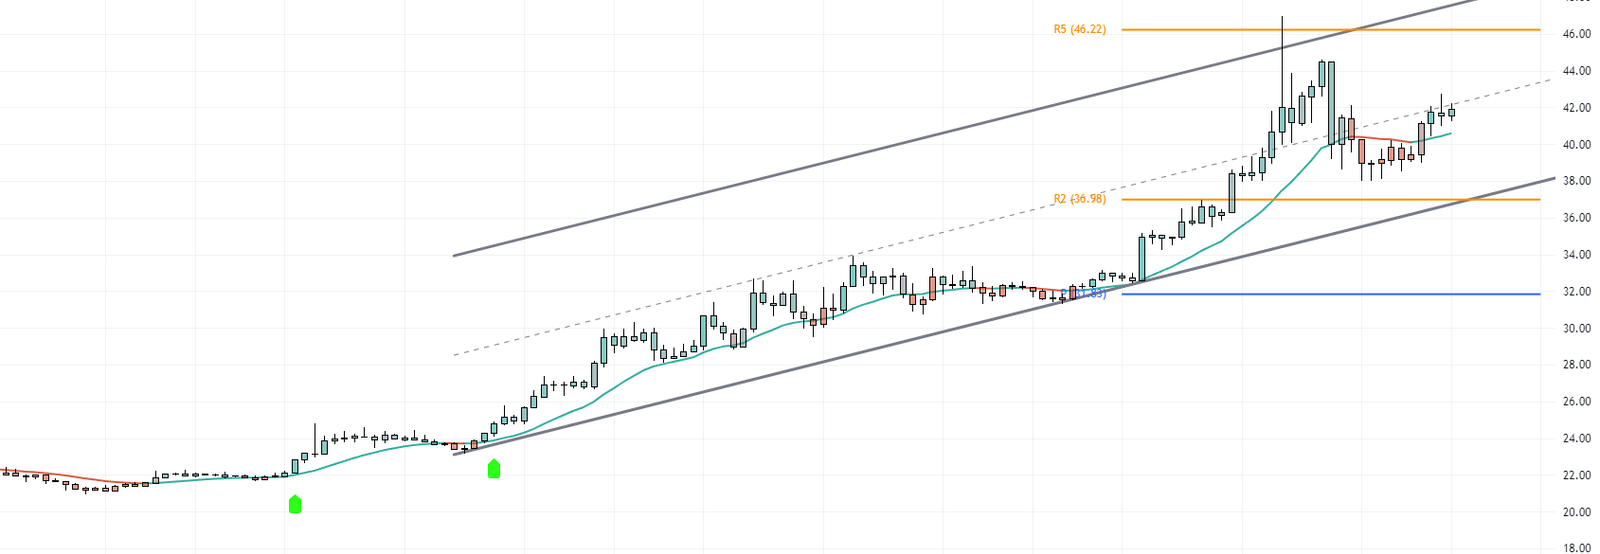
For a more detailed view of SOLUSD price action, let’s zoom into the 4-hour chart. The crypto pair trades within a bullish channel, appearing more organized than on the daily chart. Currently, SOLUSD is testing the middle line of the bullish channel, which is above the Kernel line of the Lorentzian Classification indicator. This supports the bullish scenario, suggesting that the SOLUSD price may rise and test the October high of around $46.2.

The R2 level at 36.98 supports the bullish scenario in our Solana Technical Analysis. If SOLUSD closes below this level, the bullish scenario becomes invalid, and the next bearish target is the pivot.