FxNews – In our Solana technical analysis today, we carefully examined the SOLUSD price movements on the 4-hour chart. Continue reading to fully understand the current Solana price trends and what might be next for this cryptocurrency asset.
Solana Technical Analysis – The 50-Level

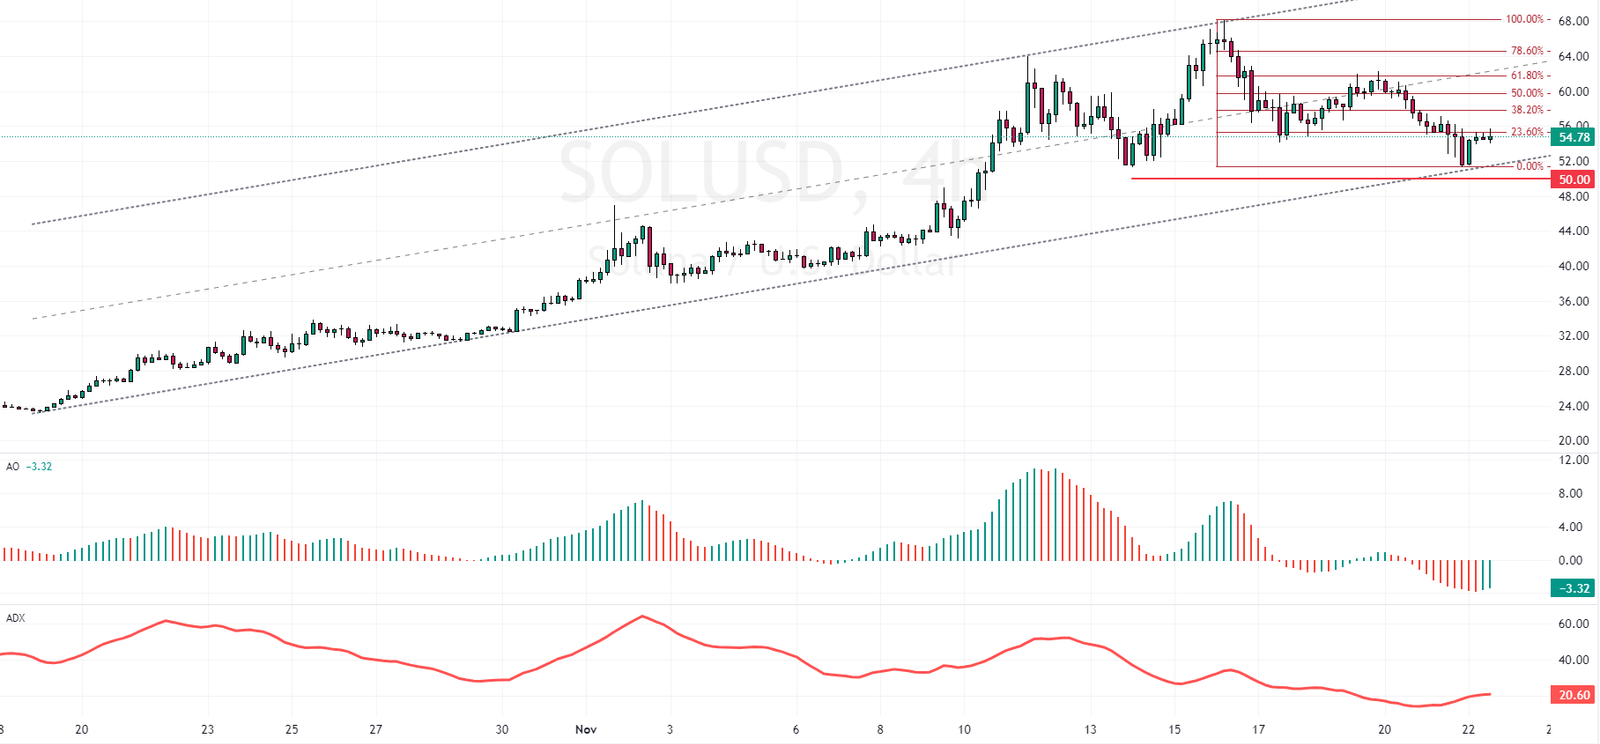
Solana recently tested the lower boundary of the bearish flag and rebounded sharply, forming a robust bullish candlestick pattern. This positive price movement is complemented by new bullish momentum, as indicated by the awesome oscillator’s green bars. Simultaneously, the ADX indicator suggests the emergence of a new trend, crossing above the crucial level of 20.
While SOLUSD navigates within the bullish flag, the central line of this flag seems to be the next target. This line coincides with the 61.8% Fibonacci retracement level.
The $50 psychological level underpins this bullish outlook. However, the bullish scenario would be deemed invalid if this level is breached.