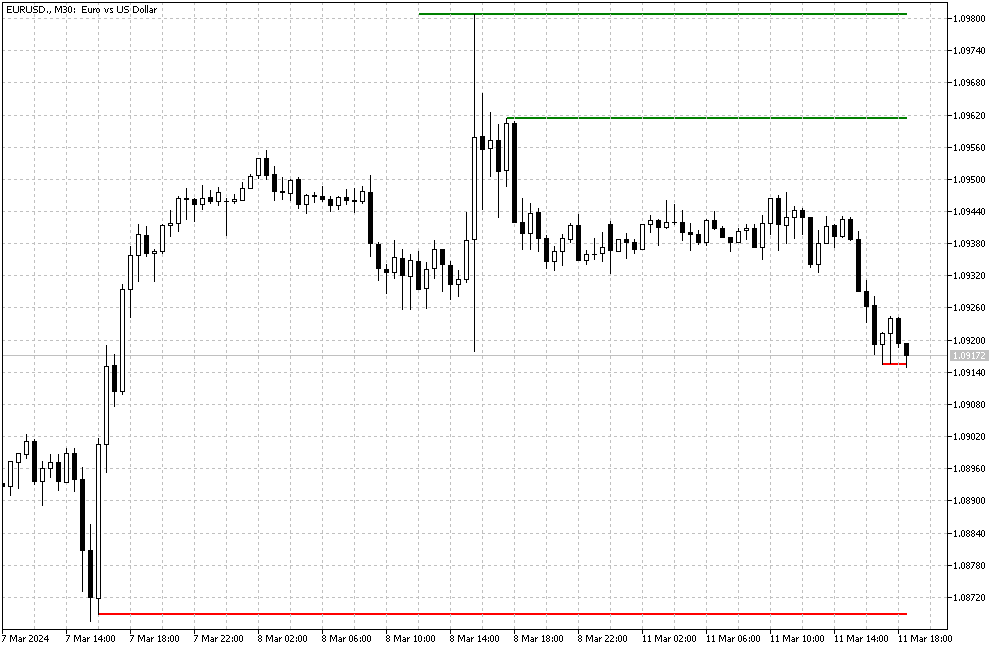
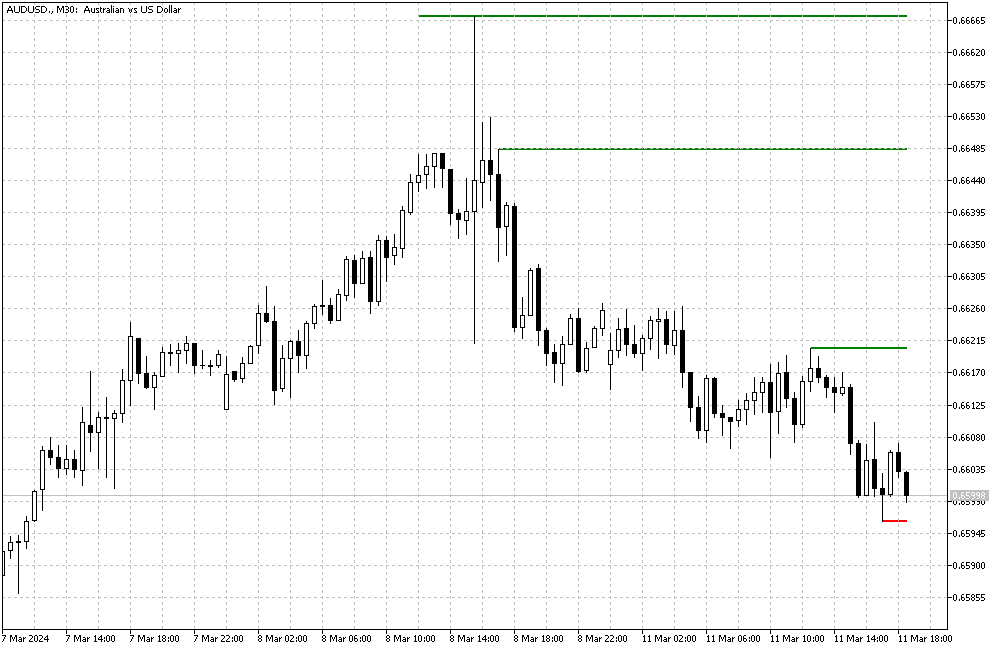
The Support and Resistance Indicator is a lighthouse for many in forex trading strategies. Particularly for those using the MetaTrader 5 platform, this tool offers critical insights that can make or break trading strategies. Let’s delve into this concept in a way that’s easy to digest, avoiding jargon and keeping things clear.
The Basics of MetaTrader 5 Support and Resistance
Before we explore the indicator itself, it’s essential to understand what we mean by support and resistance. These terms refer to specific levels on a securities chart that historically have led to a pause or reversal in an asset’s price.
Conversely, think of ‘resistance’ as the opposing team’s strength, stopping you from moving forward. In market terms, a resistance level is where prices tend to stop rising and might reverse downward.
What the Support and Resistance Indicator Does
The MetaTrader 5 Support and Resistance Indicator is a powerful tool that helps identify these key levels. It examines past price movements and pinpoints where the market has turned, marking these points as potential future barriers to price movement.
Key features include:
- Swing High and Low Identification: The indicator spots past market peaks and troughs, which is essential for understanding where support and resistance might form.
- Timeframe Flexibility: It works across different timeframes but is recommended for one-hour (H1) and four-hour (H4) charts.
- Universal Application: This tool is suitable for trading forex, cryptocurrencies, indices, or commodities.
- Alert System: It keeps you updated with pop-up alerts, push notifications, and other alert types, ensuring you never miss a key moment.
Support and Resistance MT5 Indicator: Settings Explained

In the MetaTrader 5 platform, the Support and Resistance Indicator uses a simple color code:
- Green Line: Marks the resistance levels. Think of these as ceilings that the price might struggle to break through.
- Red Line: Marks the support levels. These floors provide a safety net that the price might not fall below.
This color coding makes it straightforward to glance at a chart and immediately understand where the potential hurdles and safety nets are.
The Principle Behind the Support and Resistance Indicator

One of the core principles of technical analysis is the idea that once a support or resistance level is breached, its role is inverted. If a price drops below a support level, that level becomes resistance.
Conversely, if a price breaks above a resistance level, it becomes a new support level. This principle is crucial because it shows how past performance can influence future price behavior.
Why Use the Support and Resistance Indicator?
This tool is incredibly versatile and carries several advantages:
- Versatility: No matter what you’re trading, the principles of support and resistance apply. This makes the indicator a universal tool in your trading arsenal.
- Time-saving: Instead of manually scanning charts to identify these levels, the indicator does the heavy lifting, allowing you to focus on strategy.
- Improved Decision Making: By highlighting these key levels, the indicator helps you make informed decisions about when to enter or exit trades.
- Free to Use: One of the best features is that this indicator is 100% free. It provides high value without costing a dime.
How to Interpret the Support and Resistance Indicator
While the indicator provides valuable information, it’s crucial to understand that its effectiveness depends on interpretation. The significance of a marked level varies with each trader’s strategy and time frame. It’s not just about recognizing a line on a chart but understanding what it signifies about market sentiment and potential price movement.
Also, while the indicator can guide when to enter or exit trades, it’s not foolproof. It’s a tool, not a crystal ball. Combining its insights with other indicators and your analysis is often the best approach.
Support and Resistance Indicator Live Trading Strategy

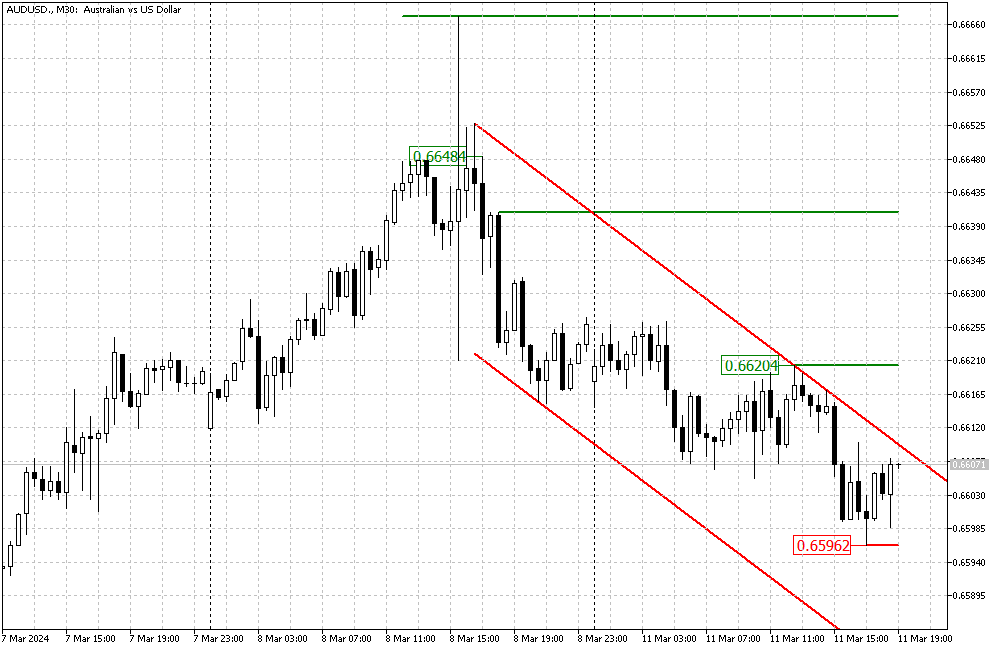
In the chart above, the AUDUSD currency pair hovers inside a bearish flag on the 4-hour chart. The support and resistance indicators show 0.6620 as the recent high and 0.6596 as today’s lowest low price.
This live trading example uses the support and resistance indicator on the MetaTrader 5 platform. We used the channel to determine the current market direction. Since the channel is declining, the market is bearish.
It is wise to make decisions in a bear market. In this scenario, if the AUDUSD price falls below today’s low, the 0.6596 mark, the downtrend will likely continue to the lower band of the bearish channel.
Conversely, the 0.6620 level acts as resistance. If this resistance is breached and the price stabilizes above it, the bear market should be considered over, and the Australian dollar would rise to test the next resistance, which is depicted in green, at the 0.6648 mark.
I hope this example can help you in your trading journey. If you have any questions regarding the indicator, I would be more than happy to assist you. So feel free to contact me anytime.
Conclusion
The MetaTrader 5 Support and Resistance Indicator is more than just lines on a chart. It reflects market psychology, guides potential price movement, and strategically aids traders. By understanding and utilizing this tool, traders can enhance their decision-making process, improve their trading strategies, and potentially increase their market success.
However, remember that all trading involves risk. While the Support and Resistance Indicator can provide valuable insights, it should be part of a comprehensive trading strategy with practice, patience, a clear plan, and management techniques. The indicator can become invalid, patience, and a clear plan.