FxNews—U.S. natural gas prices have seen a noticeable decrease, now at $2.55 per million British thermal units (MMBtu). This recent drop continues the downward trend from a peak price of $3, which hadn’t been reached in over three months.
The decline is primarily due to increased supplies and decreased demand influenced by recent hurricanes in the southeastern United States.
Surplus in Storage
According to the latest Energy Information Administration (EIA) figures, natural gas reserves have significantly increased. For the week ending October 4th, inventories in the continental U.S. increased by 82 billion cubic feet—well above the anticipated 71 billion cubic feet. This marks the most significant weekly rise since March, highlighting the strong supply situation.
Impact of Hurricane Milton
The recent Hurricane Milton has also contributed to the declining demand for natural gas. As the hurricane swept through Florida’s Gulf Coast, many households were forced to disconnect their electricity.
This reduction in electricity use led to decreased demand for natural gas, often used to power generators. This event adds to the patterns observed during the earlier Hurricane Helene, showing a recurring impact on energy use due to severe weather.
NATGAS Analysis – 10-October-2024

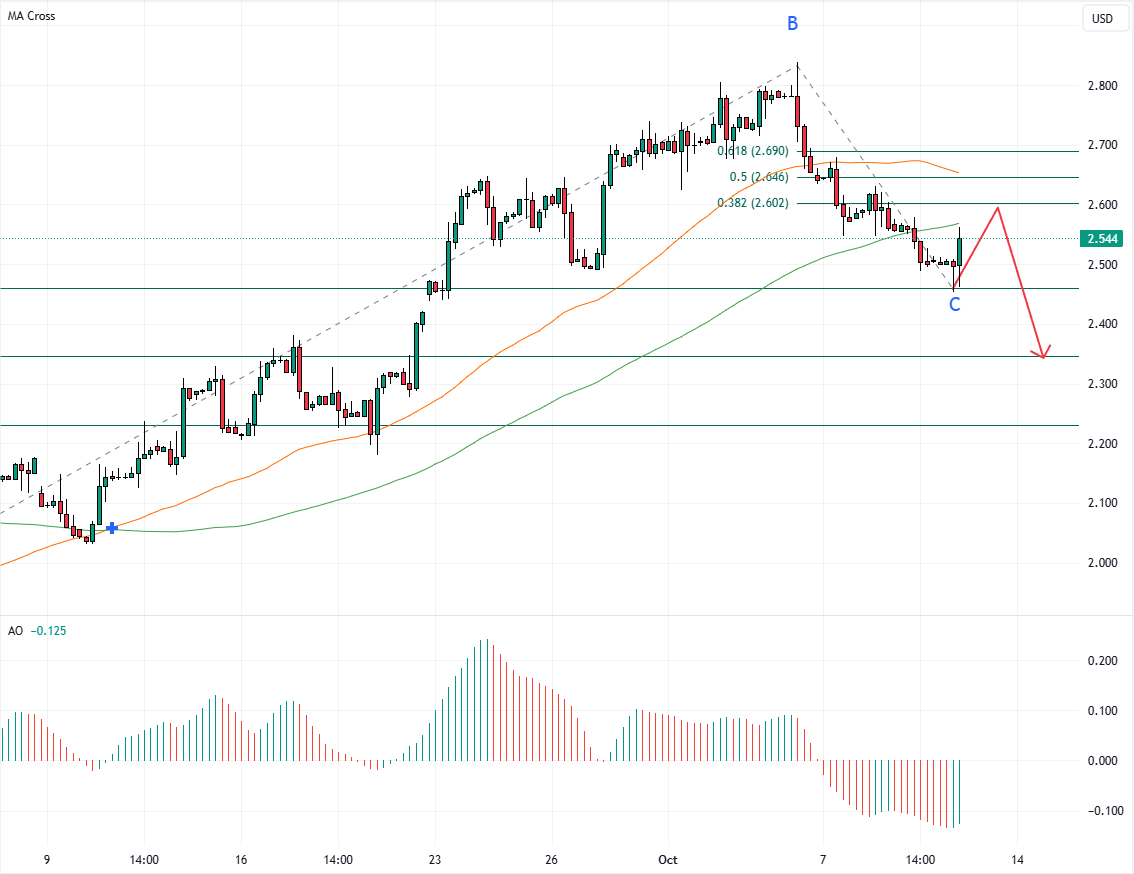
The U.S. natural gas bounced from A.B. wave’s 38.2% Fibonacci retracement level at $2.46 today, heading toward the 100-period simple moving average to test it as resistance.
The primary trend should be considered bearish since the NATGAS price trades below the 50- and 100-period SMAs. However, the Awesome Oscillator bars turned green, indicating that the bear market is weakening.
NATGAS Price Forecast – 10-October-2024

The immediate resistance rests at the 38.2% Fibonacci retracement level of the B.C. wave, which is $2.60. The Natgas price could test this level before a new bearish wave begins.
From a technical perspective, if $2.60 holds, a new bearish wave will likely emerge. In this scenario, today’s low at $2.46 could be revisited. Furthermore, if the selling pressure pushes the price below $2.46, the downtrend can potentially extend to the A.B. wave’s 50% Fibonacci retracement level at $2.34.
Please note that the bear market should be invalidated if the NATGAS price exceeds $2.60.