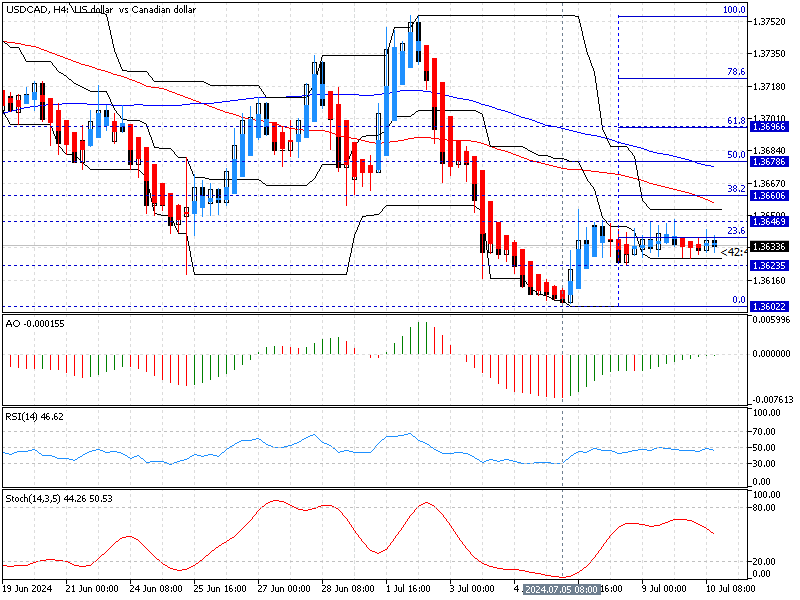
FxNews—The U.S. Dollar has traded sideways against the Canadian currency since early July, floating at about 1.363 in today’s trading session. The USD/CAD 4-hour chart below depicts the currency pair’s current exchange rate, the key support and resistance levels, and the technical indicators utilized in today’s analysis.

USDCAD Technical Analysis – 10-June-2024
The technical indicators in the 4-hour chart suggest the market is bearish. The sideways momentum could be a consolidation phase following the U.S. Dollar’s recent losses from 1.375, July’s all-time high.

- The awesome oscillator bars are clinging to the signal line, meaning the market lacks direction.
- The relative strength index indicator is below 50, depicting 46 in the value and moving alongside the median line. This means the USD/CAD lacks momentum, and the market is neither bullish nor bearish.
- The stochastic oscillator is heading down with the %K period value hovering around 50, suggesting the USD/CAD price is not overbought nor oversold.
- The current USD/CAD price is below the 50- and 100-period simple moving averages, indicating a bearish primary trend.
USD/CAD Price Forecast – 10-July-2024

The primary trend is bearish because the price is below the 50 and 100-period simple moving averages. It is important to note that the immediate resistance is at 1.362.
From a technical standpoint, for the downtrend to resume, the bears (sellers) should close and stabilize the price below the immediate resistance at 1.362. If this scenario unfolds, the next bearish target could be the July 5th low at 1.360. Furthermore, if the selling pressure drives the rate below the 1.360 support, the bear’s road to April’s low at 1.355 could be paved.
Notably, the bearish strategy should be invalidated if the USD/CAD price exceeds the key resistance level at 38.2% Fibonacci, the 1.364 mark, a level backed by the 50-period SMA.
USD/CAD Bullish Scenario
The immediate resistance is the 38.2% Fibonacci at 1.366. If the bulls (buyers) close and stabilize the price above the immediate resistance, the correction phase from 1.360 could test the 50% Fibonacci level at 1.367, a resistance zone backed by the 100-period simple moving average.
Likewise, if the buyer’s pressure exceeds 1.367, the primary trend should be considered bullish, and the road to the 61.8% Fibonacci at 1.369 could be paved.
Notably, if the price flips below the key resistance level at 1.360, the July 5 low, the bullish scenario should be invalidated accordingly.
USD/CAD Key Levels – 10-July-2024
Traders and investors should closely monitor the key levels below to make informed decisions and adjust their strategies accordingly as market conditions shift.
- Support: 1.362 / 1.360 / 1.355
- Resistance: 1.364 / 1.366 / 1.367