...

USDCHF Awaits Bullish Momentum Beyond 0.908

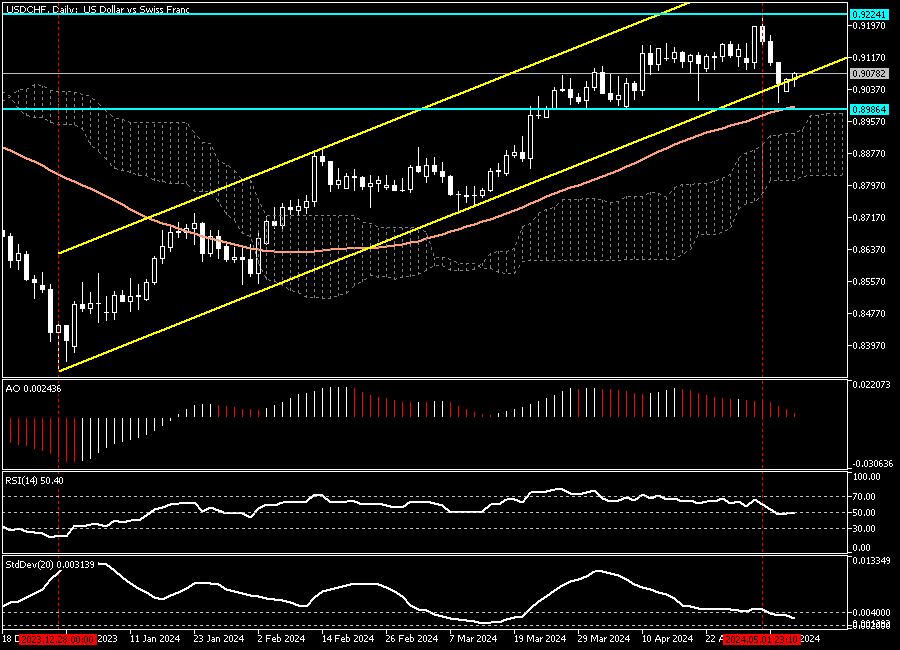
FxNews – The U.S. Dollar trades at about 0.907 against the Swiss Franc today. As shown in the USDCHF daily chart below, the pair has had an uptrend since December 8th last year. This month, massive selling pressure began on May 1st, driving the price down to $0.9.
USDCHF Awaits Bullish Momentum Beyond 0.908

The daily chart above shows sellers have failed to stabilize prices outside the bullish flag and the 0.898 support. Consequently, the price returned to the bullish flag, and as of this writing, the buyers are about to test the 0.908 minor resistance.

Standard Deviation Points to Slowing Trend

Standard Deviation Points to Slowing Trend

We zoomed into the USDCHF 4-hour chart to analyze the market behavior and the technical indicators closely to find key levels and potential trading opportunities.

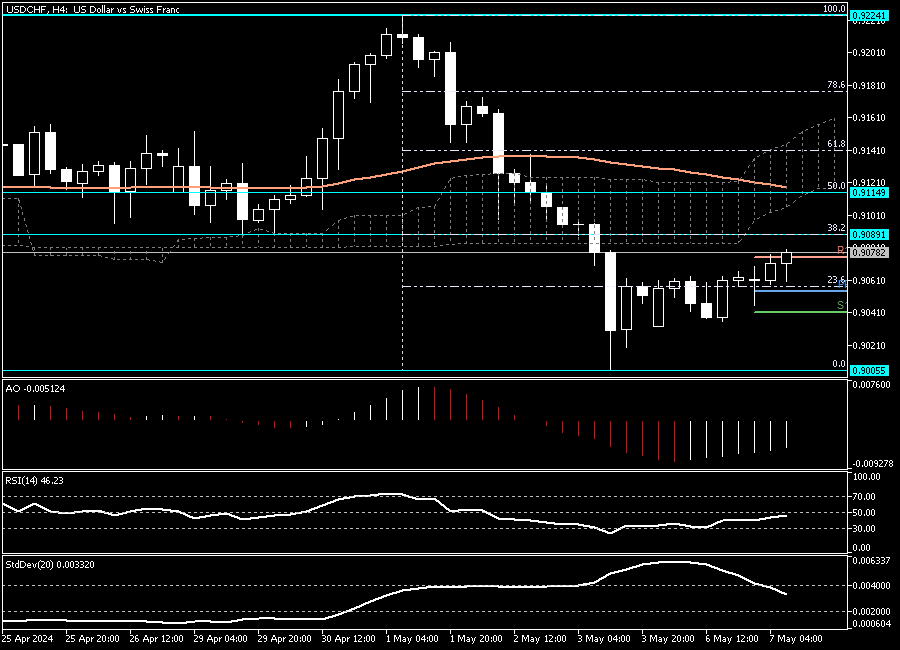
The technical tools provide mixed signals, but the Standard deviation’s value is declining, interpreted as the market trend slowing down. This suggests that investors and traders should cautiously approach the market and utilize break-out strategies, as explained below in their trading.

USDCHF Awaits Bullish Momentum Beyond 0.908
USDCHF Awaits Bullish Momentum Beyond 0.908

From a technical standpoint, the USDCHF is in a bull market. However, for the uptrend to resume, the price must close and stabilize itself above the 0.9089 resistance, which coincides with the %38.2 Fibonacci retracement level. If this scenario comes into play, the uptick momentum from 0.9 will likely extend to EMA 50 or the %50 Fibonacci resistance area, the 0.911 mark, a demand zone backed up by the Ichimoku cloud in the 4-hour chart.

USDCHF Potential Bearish Scenario

The %23.6 Fibonacci plays the pivot between a bull and a bear market. If the Swiss Franc drives the U.S. Dollar below 0.9054, the decline that began on May 1st will probably expedite and extend to 0.8986.

Latest Posts

Gold Dipped Below $2667 Awaiting Direction

Gold traded sideways after it dipped below $2,667 and...

Gas Prices Dip Under $1.99 Amid Bearish Signs

Gasoline prices dropped below $1.99, which is active resistance....

Natural Gas Rebound Targets $3.24 and Beyond

U.S. natural gas bounced from $3.1, hinted by Stochastic's...

Crude Oil Head and Shoulders Signals Downward Trend

Crude oil formed a head and shoulders pattern in...

Inverted Hammer Hints at USDJPY Consolidation Ahead

USD/JPY trades bullish amid overbought signals. The 4-hour chart...

Gold Dipped Below $2667 Awaiting Direction

Gold traded sideways after it dipped below $2,667 and...

Gas Prices Dip Under $1.99 Amid Bearish Signs

Gasoline prices dropped below $1.99, which is active resistance....

Natural Gas Rebound Targets $3.24 and Beyond

U.S. natural gas bounced from $3.1, hinted by Stochastic's...

Crude Oil Head and Shoulders Signals Downward Trend

Crude oil formed a head and shoulders pattern in...

WTI Falls Below $71.5 on New Sanctions Against Russia

WTI Crude Oil prices fell slightly below $71.5 a...

Watch for Potential Drop in Gasoline Prices Below $2

FxNews—Gasoline is bullish. However, a dip below $1.99 could...

NATGAS Tests Critical Resistance: Bears Target $3.21

FxNews—The U.S. Natural Gas trades bullish above the %50.0...

Bullish Crude Oil Signals Overbought at $70.5

FxNews—Crude Oil trades bullish, above the 75-period simple moving...