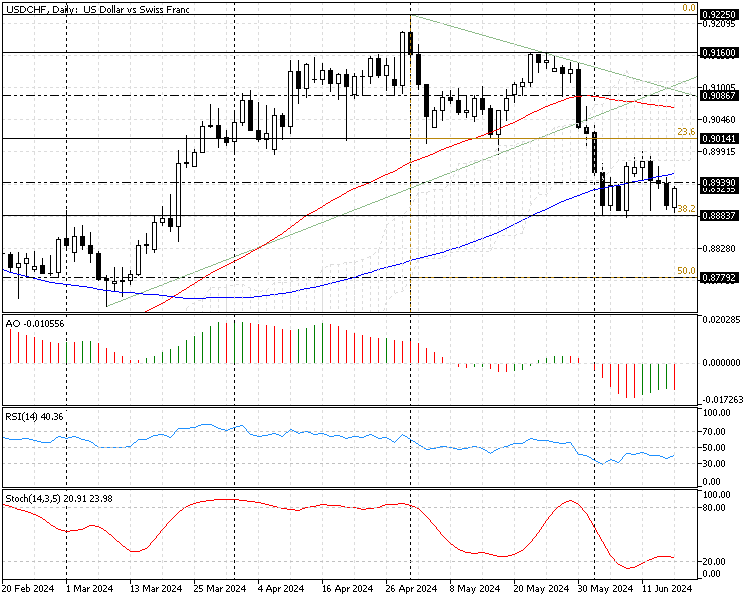
FxNews—The U.S. Dollar has been in a downtrend against the Swiss Franc since April 22. The bearish bias eased after the exchange rate dipped to the 38.2% Fibonacci level at 0.888. As of writing, the USD/CHF currency pair is experiencing a pullback, trading at about 0.893.
The daily chart below shows the currency pair is below the simple moving average of 100, testing the 0.888 key resistance level.

USDCHF Technical Analysis – 17-June-2024
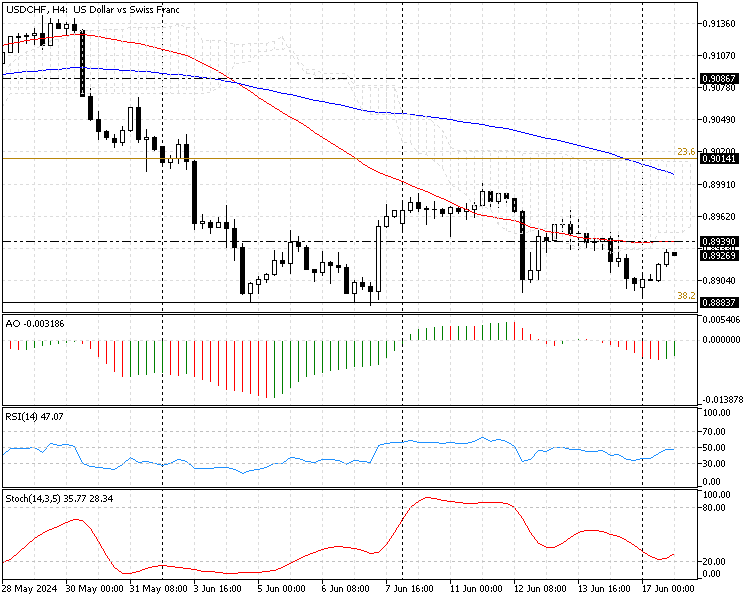
We zoomed into the 4-hour chart to examine the price action and the technical tool closely. The indicators in the 4-hour chart suggest the primary trend is bearish, but the market might experience an uptick in momentum to upper resistance levels.

- The USD/CHF price is below the simple moving averages of 50 and 100, meaning the primary trend is bearish.
- The price is below the Ichimoku cloud, another sign of a robust downtrend.
- The awesome oscillator bars are below zero, and the recent line turned green. This development in the AO bars suggests the downtrend is weakening.
- The relative strength index value is 48 and increasing, signifying the pullback is gaining strength.
- The stochastic oscillator approaches the 20 level, which indicates the market might become oversold.
USDCHF Price Forecast – 17-June-2024

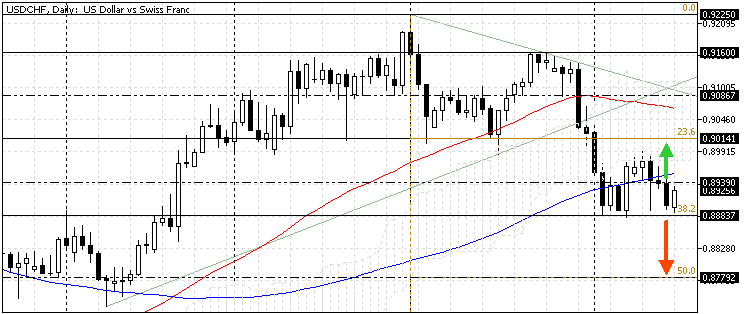
The immediate resistance is the simple moving average of 50 at 0.893 in the USD/CHF 4-hour time frame. If the bulls close and stabilize the price above this resistance, the pullback that started from the 0.888 mark could target the 23.6% Fibonacci level at 0.901. Furthermore, the $0.910 resistance is backed by the simple moving average 100.
Additionally, if the price exceeds the SMA 100, the next resistance level will be the 0.9086 mark.
The key support level for the bullish scenario is the 38.2% Fibonacci level at 0.888. If the USD/CHF price dips below the 0.888 mark, the bullish scenario should be invalidated.
USD/CHF Bearish Scenario
The 38.2% Fibonacci level at 0.888 is the key resistance level that stands still. If the bears decline the USD/CHF exchange rate below the 0.888 mark, the downtrend initiated on April 22 will likely resume. If this scenario comes into play, the next bearish target could be the 50% Fibonacci support level at 0.877.
USDCHF Key Support and Resistance Levels
Traders and investors should closely monitor the key levels below to make informed decisions and adjust their strategies accordingly as market conditions shift.
- Support: 0.888 / 0.877
- Resistance: 0.893 / 0.901 / 0.908
Disclaimer: This technical analysis is for informational purposes only. Past performance is not necessarily indicative of future results. Foreign exchange trading carries significant risks and may not be suitable for all investors. Always conduct your research before making any investment decisions.