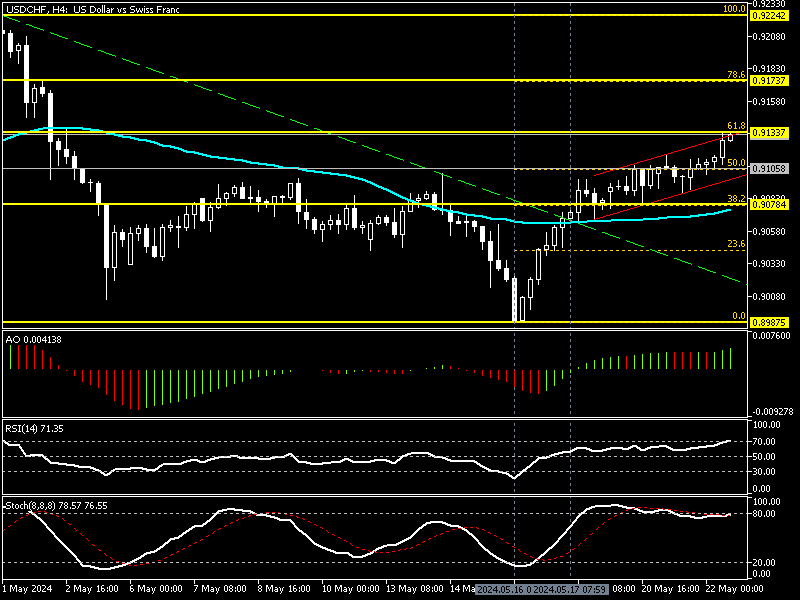
FxNews—The U.S. Dollar has been in an uptrend against the Swiss Franc since the May 16 low at 0.898. The bullish momentum accelerated after the bulls broke out from the descending trendline and crossed above EMA 50 on May 17, the 0.907 mark.
USDCHF Technical Analysis and the 61.8% Fibo Barrier

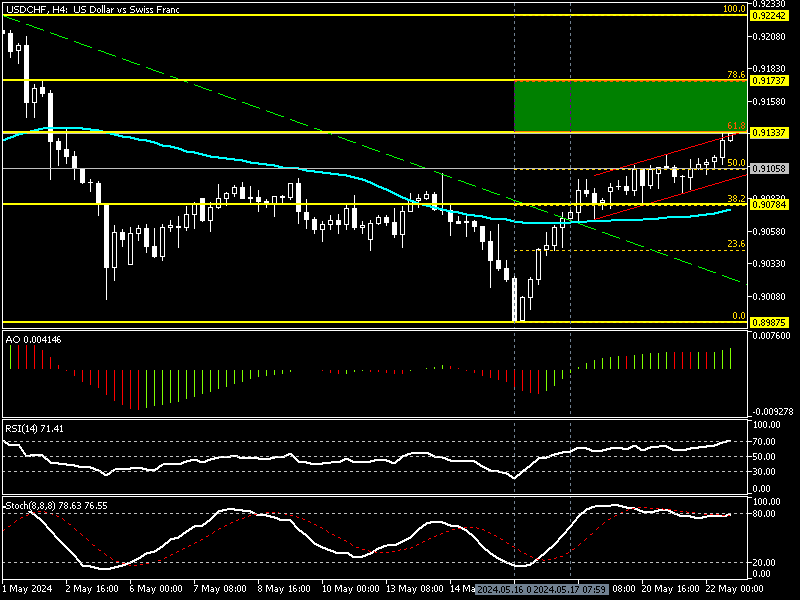
As of this writing, the USD/CHF currency pair is trading slightly below the 61.8% Fibonacci retracement level at about 0.912. The technical indicators in the 4-hour chart provide valuable information that can help us forecast bullish and bearish scenarios for the currency pair.
Technical Indicators: Green AO, Overbought RSI, and Stochastic
The awesome oscillator bars are green, above the zero line, and show 0.004 in the description. This means the bull market is robust, and further price growth can be expected.
On the other hand, the relative strength index and the stochastic oscillator warn traders and investors about the overbought market. The RSI value is 69, clinging to the overbought territory, while the stochastic oscillator %K line just returned from the overbought zone, recording 77 in the %K line.
These developments in the USD/CHF technical indicators in the 4-hour chart suggest the primary trend is bullish, but the price might consolidate to lower support levels.
USD/CHF Price Forcast – Bearish Scenario
The 61.8% Fibonacci is a barrier that can prolong or ease the current bullish momentum. With the RSI and Stochastic showing signals of a saturated market from buying pressure, the price might dip to the 50% Fibonacci level at $0.905, followed by the 38.2% Fibonacci at $0.907. It is worth noting that the secondary target is robust because it neighbors EMA 50. Therefore, traders and investors should set this deck as their target if they have short positions.
In this scenario, the bears must maintain the USD/CHF value below the immediate resistance of $0.913.
The Bullish Scenario

As explained in our USD/CHF technical analysis, the primary trend is bullish, but the U.S. Dollar faces immediate resistance at $0.913. For the uptrend to resume, the buyers must close and stabilize the price above this level. If this happens, the road to %78.6 Fibonacci at $0.917 will likely be paved.
USD/CHF Key Support and Resistance Levels
Traders and investors should closely monitor the USD/CHF key levels below to make informed decisions and adjust their strategies accordingly as market conditions shift.
- Support: $0.910, $0.907
- Resistance: $0.913, $0.917
Swiss Bond Yields Steady as Central Banks Eye Rate Cuts
Bloomberg—The 10-year yield on Swiss government bonds is currently around 0.7%. This has instructed traders and investors to wonder when the Federal Reserve would start reducing interest rates. While the Fed is anticipated to decrease borrowing costs within the year, the exact timing of this initial cut remains uncertain.
On the contrary, the Swiss national bank shocked the market by lowering the interest rate by 25 basis points to 1.5% in March. This has led the U.S. dollar to rise against the Swiss dollar, and the technical analysis above and the chart show that the USD/CHF is in an uptrend, which might break the 61.8% Fibonacci barrier.
It is worth noting that the Swiss National Bank has not lowered the interest rate in nine years, making it the pioneer among other central banks in easing its monetary policy this year.