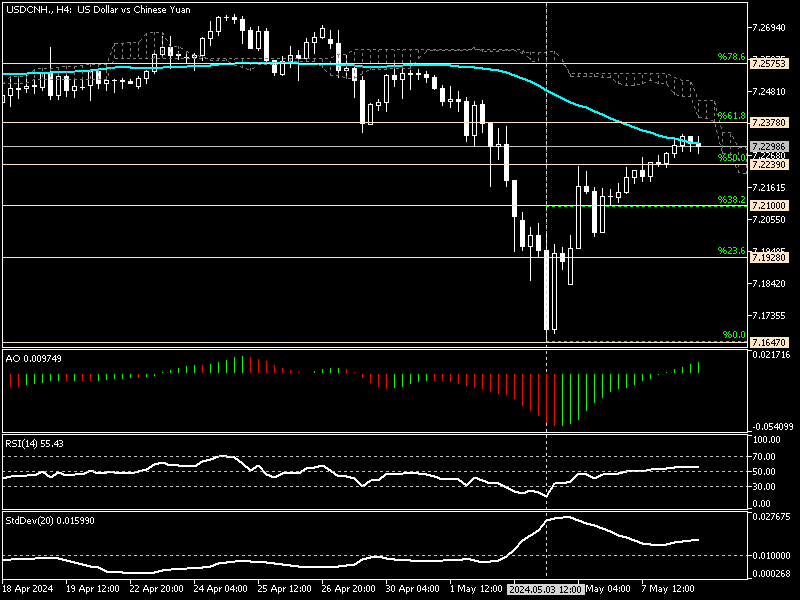
The U.S. dollar made a comeback against the Chinese currency, Yuan. As of writing, the USDCNH bullish momentum eased near the 7.23 resistance, a barrier that has further support from EMA 50 and the %61.8 Fibonacci retracement level.
USDCNH Rise Leaves Bullish Signals Intact

The daily chart above shows that the technical indicators are still bullish despite the recent jump in the Dollar’s value against the Yuan.
The awesome oscillator bars are in red and below the signal line, and the RSI indicator is nearing the median line from below. In addition to AO and RSI, the standard deviation indicator value is increasing, which signals that the trend is active and the market volatility is increasing.
We zoom into the 4-hour chart and perform a detailed technical analysis to find key levels and potential trading opportunities.
USCNH Technical Analysis – The 4-Hour Chart

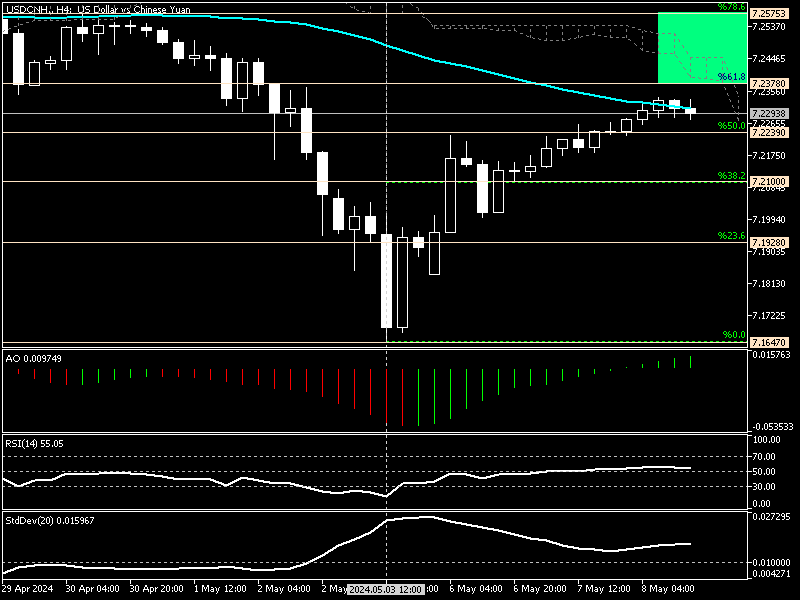
The 4-hour chart grants an interesting outlook. As shown in the chart above, the USDCNH pair trades at about 7.22 at the time of writing. That’s below the Ichimoku cloud, meaning the price has the potential to dip again, but the technical indicators in the 4-hour chart are bullish. The awesome oscillator bars are green and above the signal line, and the RSI flipped above 50.
The technical indicators in the daily chart are bearish, but the 4-hour chart gives the opposite signal. This is normal because the technical tools are lagging indicators, especially in bigger time frames such as daily, weekly, and monthly.
USDCNH Forecast – Pullback Faces Resistance at 7.23

From a technical perspective, the pullback that began on May 3rd from 7.16 now faces the 7.23 barrier, a resistance area backed up by the Ichimoku cloud and the %61.8 Fibonacci. Therefore, the USDCNH price must close and stabilize itself above 7.23 for the uptrend to resume.
If this scenario comes into play, the path to 7.25, which coincides with %78.6 Fibonacci, will be paved.
USDCNH Bearish Scenario

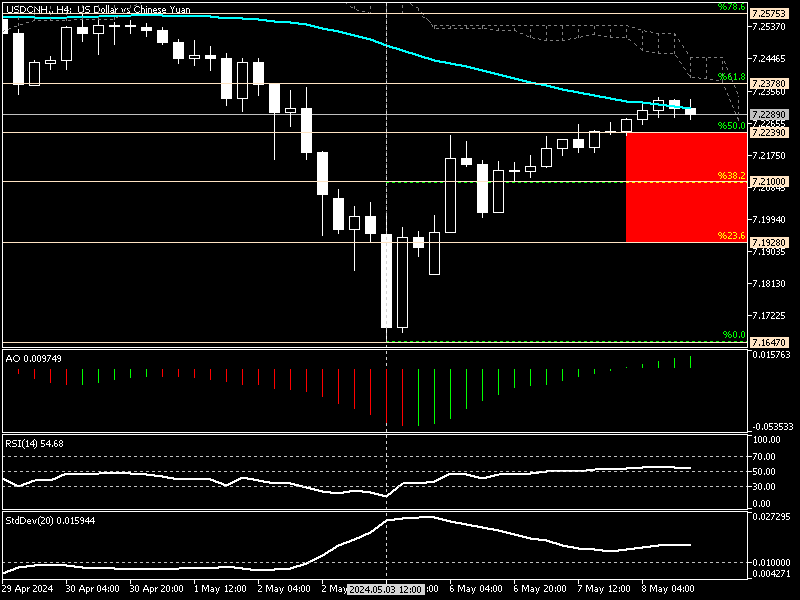
Earlier in this article, we mentioned that the price is still below the Ichimoku cloud. Thus, the bears still have the chance to step in and reverse the market. For the market to turn bearish, the USDCNH price should dip below the %50 Fibonacci, the 7.223 mark. In this case, today’s peak will be considered a new “higher low,” and the dip will likely expand to %38.2 Fibonacci (7.21) followed by 7.19.