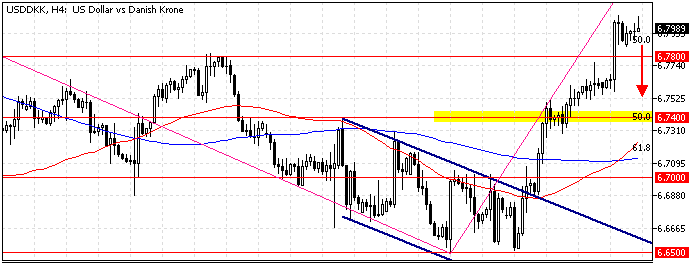
FxNews—The U.S. dollar is in a bull market against the Danish Krone, nearing the 61.8% Fibonacci retracement level of the AB wave at 6.82.
As of this writing, the USD/DKK pair trades slightly below the Fibonacci level at about 6.98. The 4-hour chart below demonstrates the price, support, resistance levels, and technical indicators utilized in today’s analysis.

USDDKK Technical Analysis – 7-October-2024
Robust buying pressure drove the Stochastic and RSI 14 indicators into the overbought zone, depicting 82 and 72, respectively. This development in the momentum indicators indicates that the USD/DKK pair is overbought, and the price might consolidate before the uptrend resumes.

The primary trend is bullish because the price is above the 50- and 100-period simple moving averages. On the other hand, the Awesome oscillator declines with red bars above the signal line.

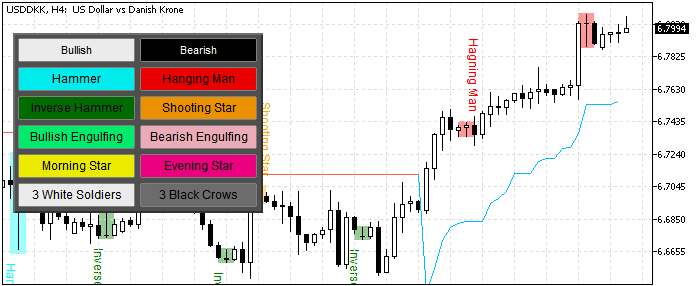
As for the candlestick patterns, the 4-hour chart has formed a ‘Hanging Man,’ which signals the potential initiation of a bear market.
Overall, the technical indicators suggest the primary trend is bullish. Still, the USD/DKK price is overpriced, and it might dip and test the lower support levels before the uptrend resumes.
USDDKK Forecast – 7-October-2024

From a technical perspective, if the critical resistance level at the 61.8% Fibonacci holds, the USD/DKK price can potentially experience a decline toward the 6.74 mark. Notably, the 6.74 resistance is backed by the 50% Fibonacci retracement level of the B.C. wave, concides the September 19 high.
Please note that the bull market should be invalidated if the USD/DKK rate falls below 6.70.
USD/DKK Bullish Scenario – 7-October-2024
The primary resistance rests at 6.83, neighboring the August 8 low and the 61.8% Fibonacci retracement level. The uptrend will likely be triggered again if the USD/DKK price exceeds 6.820. If this scenario unfolds, the next bullish target will be the August 8 high at 6.855.
USDDKK Support and Resistance Levels – 7-October-2024
Traders and investors should closely monitor the key levels below to make informed decisions and adjust their strategies accordingly as market conditions shift.
- Support: 6.780 / 6.740 / 6.70
- Resistance: 6.820 / 6.855