USDDKK Forecast – February-6-2024

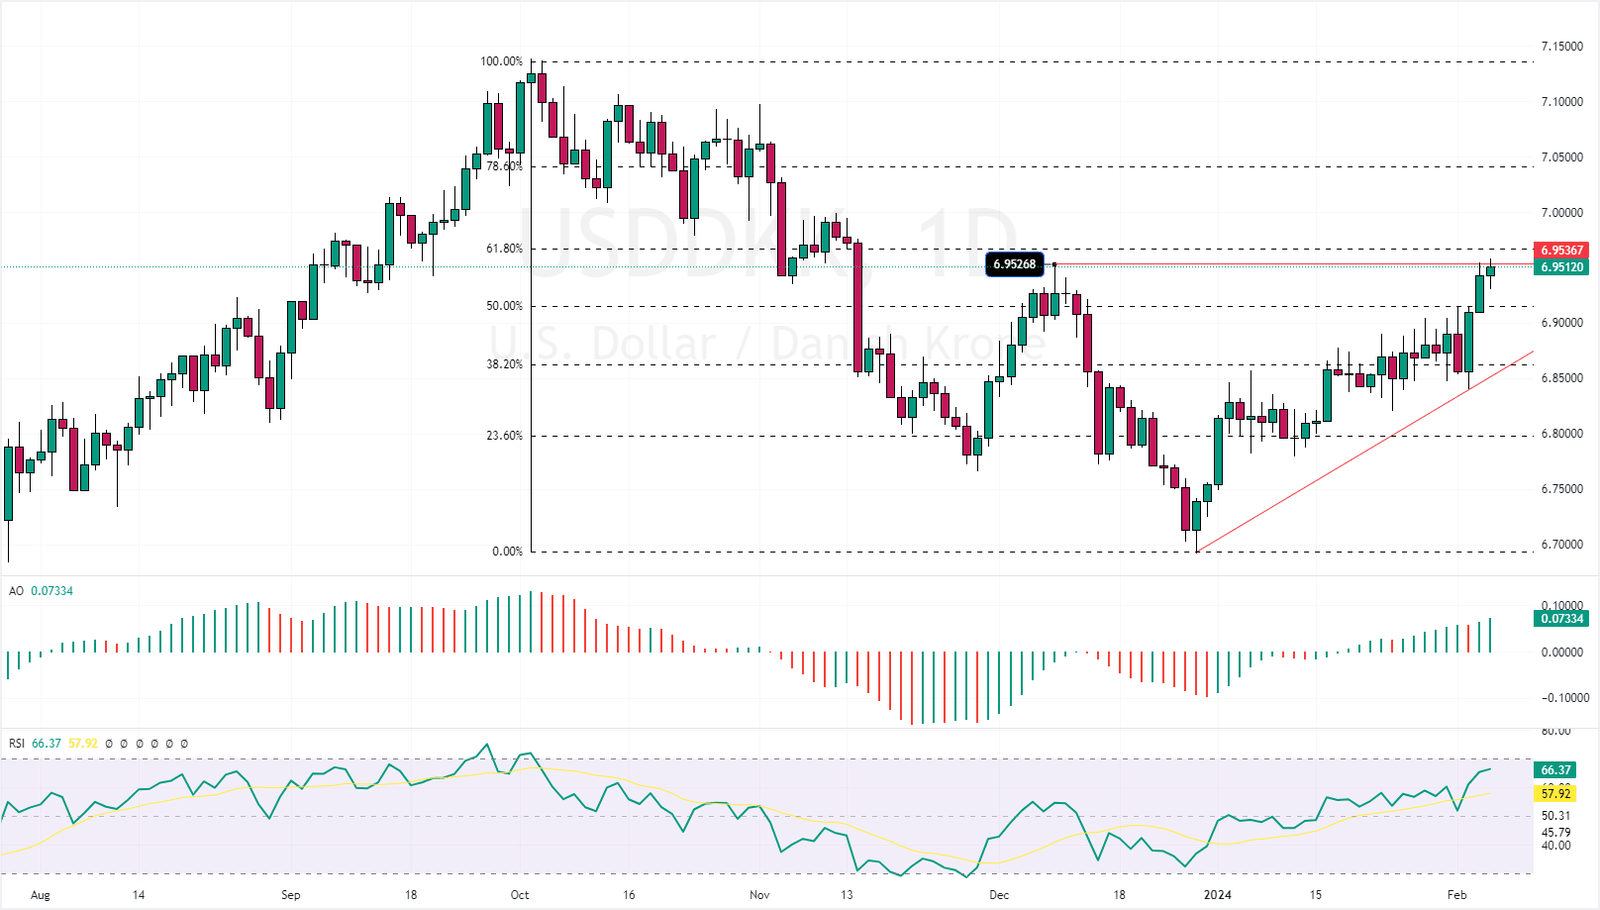
The USDDKK (U.S. dollar vs. Danish Krone) traded close to the 6.9 resistance in today’s trading session. The pair has a slight pullback from the resistance, and the price is 6.949 at the time of writing.

The trend seems bullish, with the RSI and awesome oscillator indicators hovering above the signal line. However, the 6.9 acts as a hurdle that might halt further increase in the pair’s price. The 50% Fibonacci retracement level further supports this resistance area, making it stronger.
USDDKK Forecast - February-6-2024
USDDKK Forecast – February-6-2024 | Daily Chart

USDDKK Forecast: 4-Hour Chart Analysis

We should zoom into the USDDKK 4-hour chart to better understand the pair’s price action and what might be next.

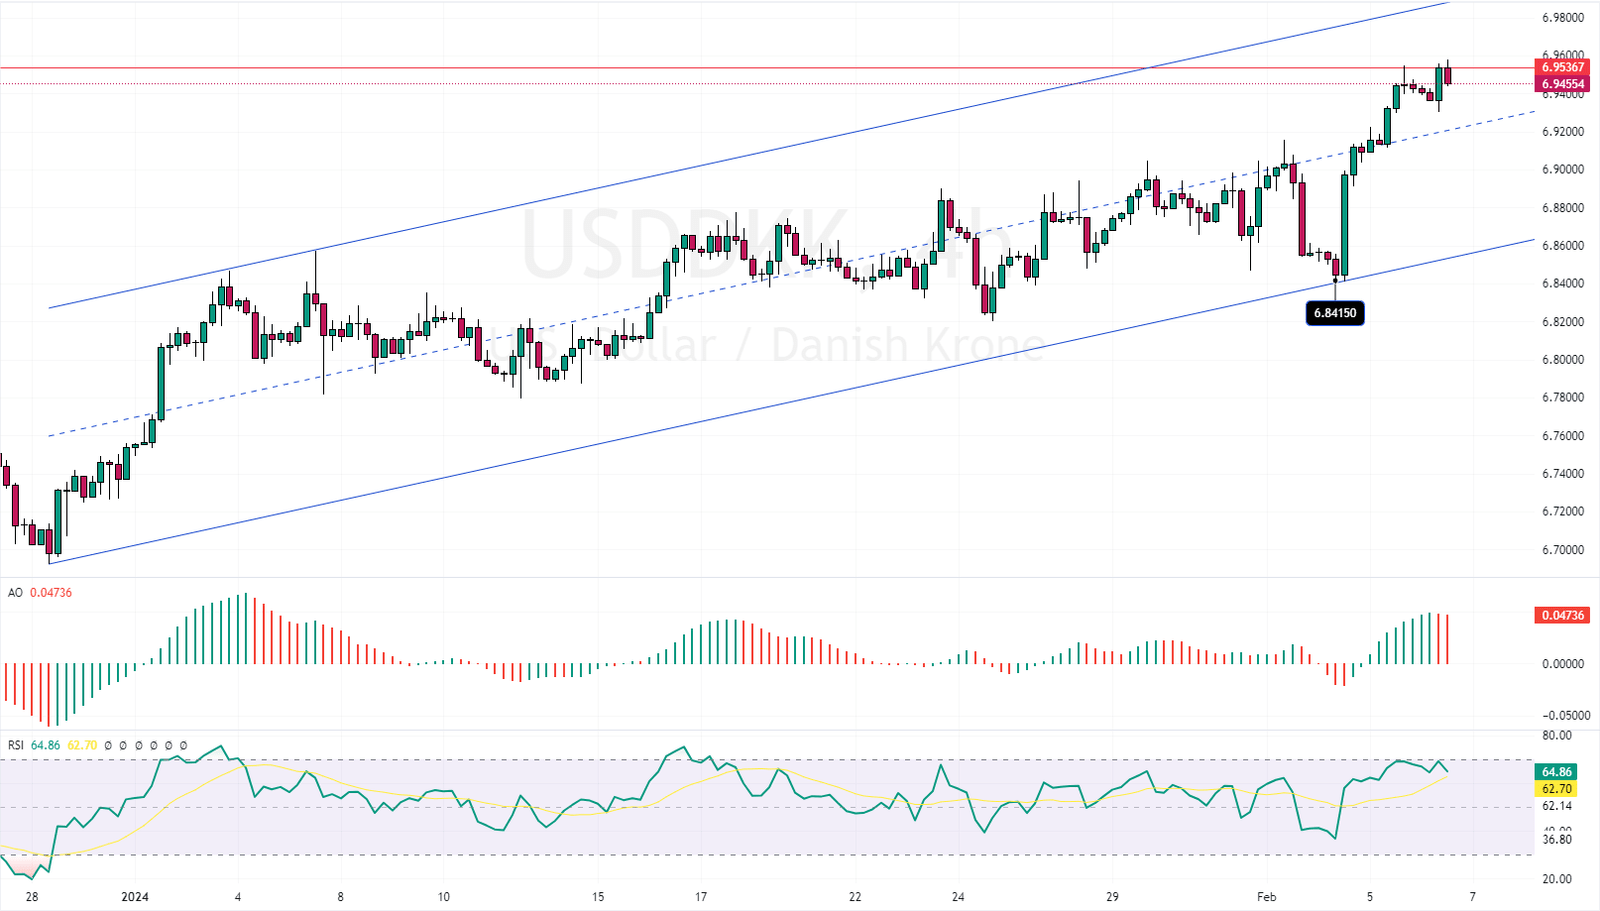
The 4-hour chart provided us with new data. The pair is trading in the bullish flag, testing the 6.9 resistance as mentioned in the pair’s daily technical analysis. However, the RSI indicator is returning from the 70 level, and the Awesome oscillator bars have turned green, which could signal an imminent pullback or start of a consolidation phase.
USDDKK Forecast - February-6-2024
USDDKK Forecast – February-6-2024 – 4-Hour Chart

In addition, the 4-hour chart formed a doji candlestick pattern, suggesting another correction might be on the horizon. From a technical standpoint, if the USDDKK price maintains a position below the 6.9 resistance or the 50% level of the Fibonacci, it might decline to 6.8 support, the lower band of the bullish flag.

Conversely, if the bulls close above the 6.9 resistance, the road to the upper flag band will be paved.

Copenhagen Index Hits Record Growth

Bloomberg—The Copenhagen stock market index reached a record 2532.00 points. In the last four weeks, it rose by 8.19%; over the past year, it grew by 33.7%.

Latest Posts

Bitcoin Analysis: Technical, Fundamental & News

Discover the latest Bitcoin analysis with our expert insights....

GBPUSD Analysis: Technical, Fundamental & News

Discover the latest GBPUSD analysis with our expert insights....

EURUSD Analysis: Technical, Fundamental & News

Discover the latest EURUSD analysis with our expert insights....

EURUSD began consolidating from 1.017: rose 0.85%

EURUSD began consolidating from 1.017 and rose 0.85%, trading...

Litecoin Gained 7.1%: What’s the Next Target?

Litecoin gained 7.1%, marching slowly toward $100.0. The uptrend...

Gold Exceeded $2665: Now Overbought!

Gold exceeded $2665 resistance. However, robust buying pressure made...

Bullish Symmetrical Triangle Signals NATGAS Breakout

NATGAS trades sideways in a low-momentum market inside the...

Crude Oil Holds at $72.8 After Initial Price Dip

Crude Oil price dipped from $75.24, testing the %50.0...

Gold Stays Below $2665 Ahead of US Economic Data

On Monday, the price of gold remained below $2,665...

US Gasoline Futures Hit $2.07 Amid Oil Surge Amid Oil Surge

Gasoline futures in the US have climbed past $2.03...

NATGAS Dips 14% Amid Low Storage Draws

Natural gas prices in the U.S. fell sharply by...

WTI Crude Slips From $74 as Dollar Strengthens

Crude oil prices for West Texas Intermediate (WTI) dipped...

NATGAS is Hit $4 As the Year Ends

NATGAS hit $4.0, trading in a robust uptrend. The...