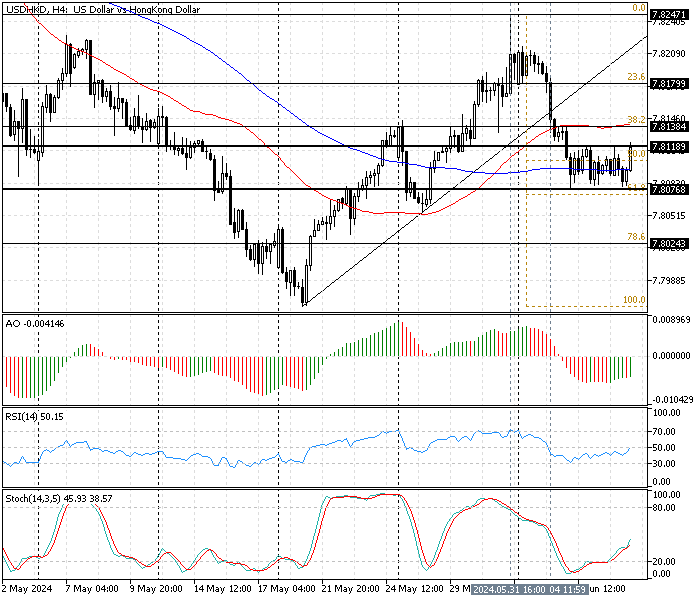
FxNews—The American currency has been in a downtrend against the Hong Kong Dollar since May 31, after the pair peaked at the 7.824 ceiling. The USD/HKD downtrend escalated after the bears broke below the ascending trendline and EMA 50 on June 4, at 7.813.
This development in the Hong Kong Dollar eased after the currency pair neared the 61.8% Fibonacci resistance level, approximately 7.807. As of this writing, the USD/HKD price hovers above SMA 100 and tests the immediate resistance at 7.811.
The 4-hour chart below demonstrates the Fibonacci levels, key technical indicators, and trendlines pertaining to the currency pair in question.
USD/HKD Technical Analysis – 7-June-2024

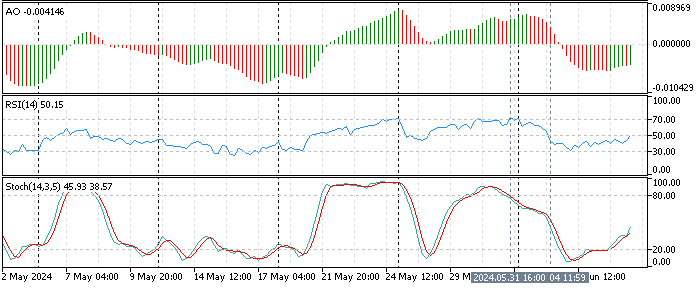
The currency pair ranges sideways between 7.807 immediate support and 7.811 immediate resistance. The awesome oscillator value is on the rise, showing -0.004 in the description. The indicators’ recent bar turned green, but they are still below the signal line. This development in the AO suggests the downtrend is weakening and losing momentum.

- The relative strength index indicator nears the 50 line, showing 49 in the description, signifying that the downtrend has eased and the market is moving sideways with mild bullish momentum.
- The stochastic oscillator %K line is 38, almost in the middle. This growth in the stochastic means the market is not oversold or overbought, but it has bullish tendencies, and the price might climb higher.
These developments in the technical indicators in the USD/HKD 4-hour chart suggest the current trend is sideways, with a weak bullish momentum.
USDHKD Forecast – 7-June-2024

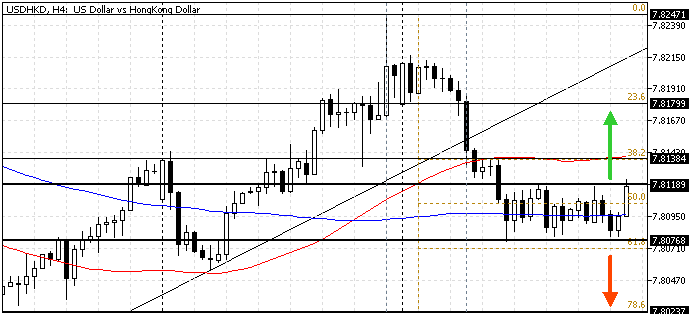
The currency pair ranges narrowly between 7.807 support and 7.811 resistance. It is currently testing the immediate resistance.
From a technical standpoint, if the USD/HKD price breaks above 7.811, the 38.2% Fibonacci at 7.813 could be the next resistance. Furthermore, if the bull adds pressure and the price exceeds 7.813, the 23.6% Fibonacci level, which coincides with the May 3 low at 7.817, could be targeted.
If this scenario unfolds, the 7.811 should be considered as resistance to the new USD/HKD uptrend wave.
Bearish Scenario
The immediate support is located at 7.807. If the USD/HKD price dips below this support, the downtrend from May 31 will likely resume, and the 78.6% Fibonacci at 7.802 will be the next support area.
The simple moving average of 100 will support the bearish scenario.
USD/HKD Key Support and Resistance Levels
Traders and investors should closely monitor the key levels below to make informed decisions and adjust their strategies accordingly as market conditions shift.
- Support: 7.807 / 7.802
- Resistance: 1.811 / 7.813 / 7.817
Disclaimer: This technical analysis is for informational purposes only. Past performance is not necessarily indicative of future results. Foreign exchange trading carries significant risks and may not be suitable for all investors. Always conduct your research before making any investment decisions.