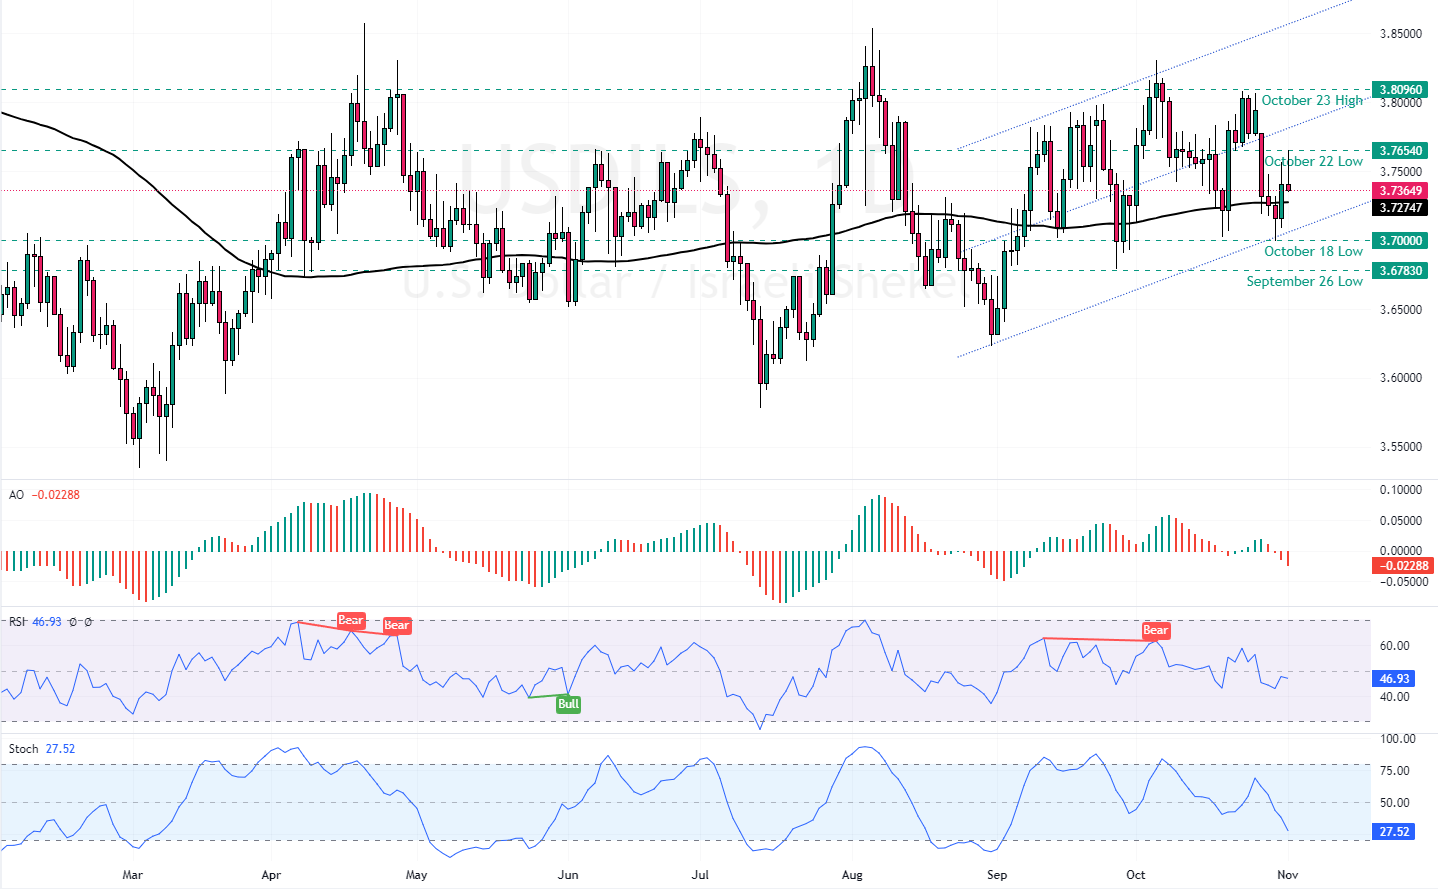
FxNews—The USD/ILS currency pair trades sideways but mildly bullish above the 100-period simple moving average. As the daily chart shows, the price is inside the bullish flag.

USDILS Forecast – 1-November-2024
As of this writing, the pair is trading at approximately 3.741, declining from the October 22 low (3.765).
The Awesome Oscillator bars are red below the signal line, meaning the bearish trend should prevail. Furthermore, the RSI 14 is below the median line, and the Stochastic Oscillator approaches the oversold territory, depicting 28 in the description.
Overall, the technical indicators suggest while the primary trend is bullish, the USD/ILS uptick momentum is pursued at 3.765, and the price could experience further losses.
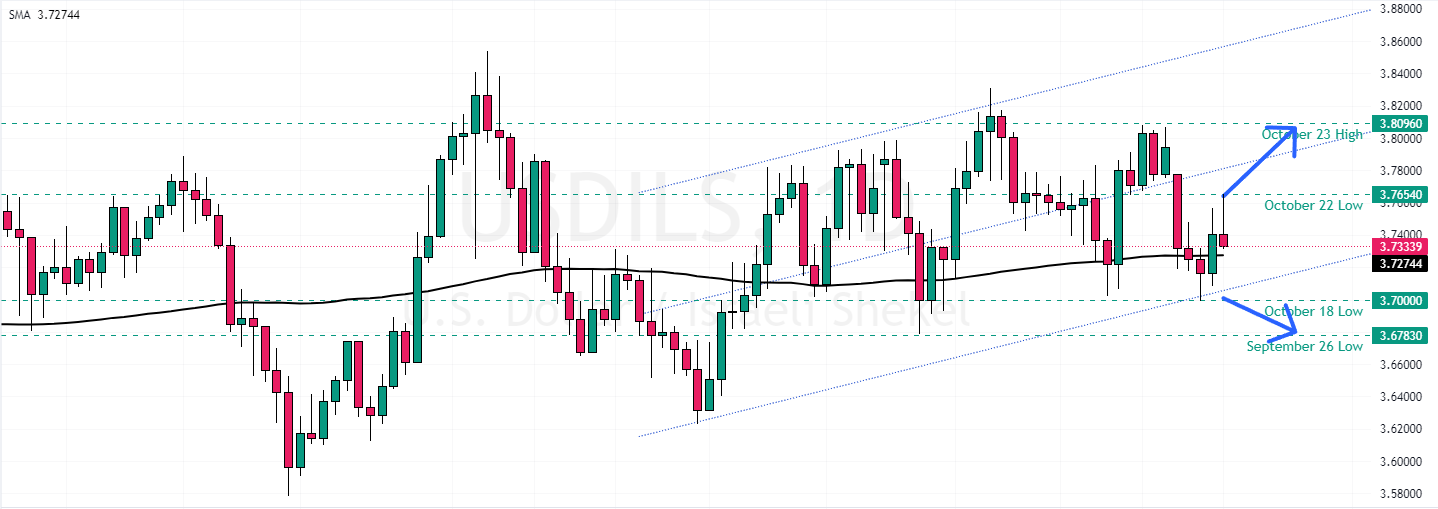
USDILS Bulls Eye New High If 3.765 Breaks

From a technical perspective, the immediate resistance is at 3.765. The uptrend resumes if buyers (bulls) close and stabilize the USD/ILS price above the 3.765 mark. If this scenario unfolds, the next bullish target could be the October 23 high at 3.809.
Bearish Scenario
The immediate resistance rests at the October 18 low, the 3.70 mark. If bears close and stabilize the price below 3.7, a new bearish wave will likely form, which could result in the USD/IL price dipping toward 3.678, the September 26 low.