FxNews—The Japanese yen remained weak, trading around 153 against the dollar this Tuesday. This level is close to its three-month low, influenced by recent political events in which Japan’s ruling party lost its parliamentary majority.
This loss has created uncertainty regarding the Bank of Japan’s future policies, which aim to phase out long-standing monetary stimulus measures. Despite these challenges, the leader of the Democratic Party For People advised the Bank of Japan to maintain its current policies as wages have not increased.
Japan Ready for More Yen Support as Slide Continues
On another front, the yen’s continued depreciation has led Finance Minister Katsunobu Kato to announce the government’s alertness to modifications in the foreign exchange market. Investors are concerned that if the yen weakens further, possibly reaching 160 against the dollar, another government intervention in the currency market may start.
Additionally, the yen is under external pressure from a strengthening dollar, driven by expectations of a more conservative approach to Federal Reserve rate cuts and speculations of a Trump victory in the upcoming November elections.
USDJPY Technical Analysis – 29-October-2024

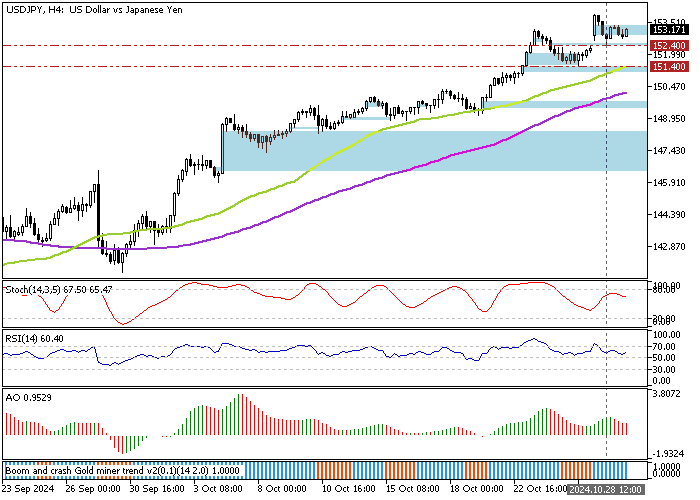
The U.S. dollar trades bullish against the Japanese yen, as the price is above the 50- and 100-period simple moving averages. Yesterday, the USD/JPY pair had a small dip and filled the Fair Value Gap area 1t 152.4; consequently, the uptrend resumed.

Zooming at the USD/JPY daily chart, we notice that the American dollar is overpriced regarding technical analysis. Therefore, going long on the pair at the current price is not advisable. That said, if bears (sellers) push the price below the 152.4 support, a new consolidation phase will likely form, which could target the 50-period moving average at 151.4 (October 25 Low).
If this scenario unfolds, traders and investors should monitor the 151.4 support for bullish signals such as a hammer or a bullish engulfing candlestick pattern.