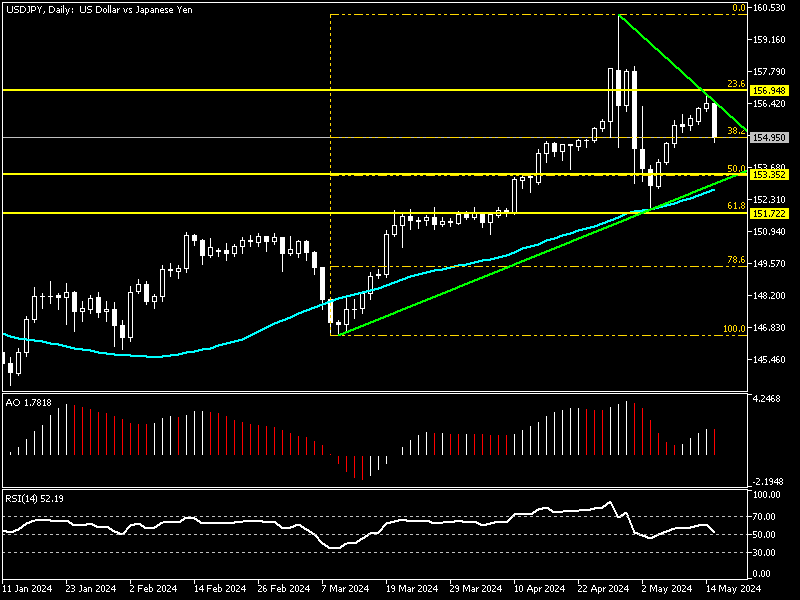
FxNews—The U.S. Dollar is in an uptrend against the Japanese Yen. As of this writing, the USD/JPY pair trades at about 154.9 clung to the 38.2% Fibonacci retracement level.

The technical indicators signal a bearish trend in the daily chart against the primary uptrend. The relative strength index is about to flip below 50, and the awesome oscillator bars just turned red.
These developments in the technical indicators increase the possibility that the bearish momentum initiated from 156.9 (23.6% Fibonacci) might expand to the lower line of the wedge pattern. Note that the wedge bottom line has the EMA 50 and the %50 Fibonacci level as a backup; this level is marked as 153.3.
We zoom into the USD/JPY 4-hour chart to conduct a detailed analysis and find key levels and trading opportunities.
Yen Stabilizes Below EMA 50 – Bearish Signals Ahead

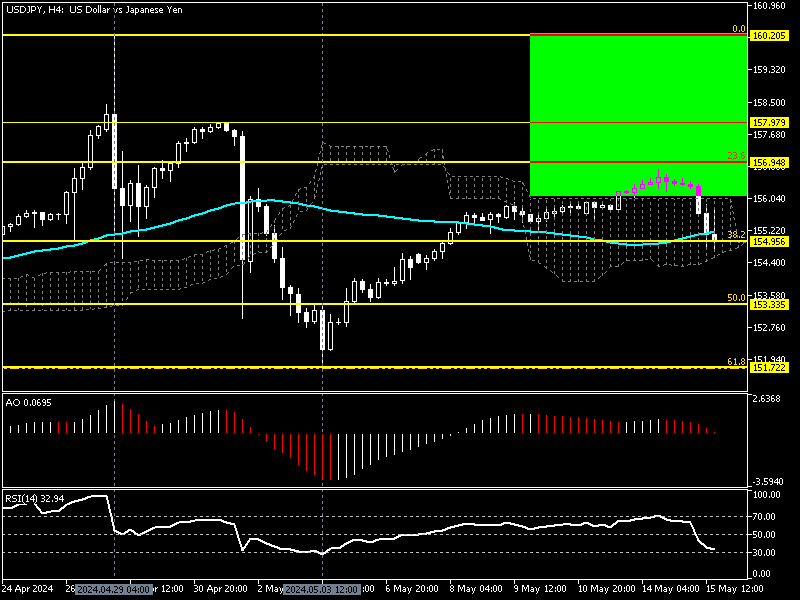
The 4-hour chart above shows no significant pattern, but the Japanese yen is trying to stabilize the exchange rate below EMA 50 and the 38.2% Fibonacci retracement level, the $154.9 mark. Concurrently, the awesome oscillator and RSI signal the downward momentum should resume, aligning with their signal on the daily chart.
In conclusion, the technical indicators tell us that the U.S. dollar might dip, and Yen has the chance to correct some of its recent losses.
USDJPY Drop Below 154.9 Signals Deeper Fall

From a technical standpoint, if the USD/JPY price stabilizes itself below 38.2% Fibonacci, the 154.9 mark, the bearish momentum that began yesterday from 156.9, will likely dig deeper to test 153.3 followed by the May 3 low, the 151.7 mark.
USD/JPY Bullish Scenario

On the flip side, the bearish trend should be invalidated if the USD/JPY price returns above the Ichimoku cloud or the 155.8 mark. If this scenario comes into play, the primary trend will likely resume, and buyers’ next target can be 157.9, followed by April’s all-time high, the 160.2 ceilings.