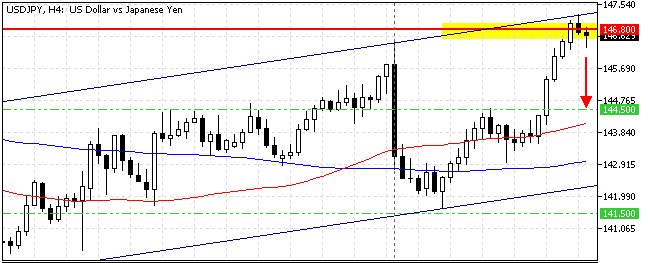
FxNews—The U.S. dollar began a new bullish wave from 141.5 against the Japanese yen, testing the September 27 high at 146.8 in today’s trading session.
The USD/JPY 4-hour chart below demonstrates the price, support, resistance levels, and technical indicators utilized in today’s analysis.

USDJPY Technical Analysis – 3-October-2024
The USD/JPY primary trend should be considered bullish because the price is above the 50- and 100-period simple moving averages.
However, the robust buying pressure and the steep uptrend resulted in the Stochastic and RSI indicators signaling an overbought market, meaning a consolidation phase or a trend reversal could be on the horizon. Additionally, the Awesome oscillator histogram is green and above the signal line, signifying the bull market prevails.
Overall, the technical indicators suggest the primary trend is bullish, but the USD/JPY price might dip before the uptrend resumes.
USDJPY Forecast – 3-October-2024

The September 27 high at 146.8 is the immediate resistance. Meanwhile, the momentum indicators demonstrate an overbought market. Hence, it is not advisable to join the bull market when it is saturated with buying pressure.
From a technical perspective, a consolidation phase to the October 1 high at 144.5 is likely if the immediate resistance at 146.8 holds. The 50-period SMA backs this support level, making it a reliable supply zone.
That said, retail traders and investors should monitor the 144.5 support area closely for bullish signals, such as a hammer of a bullish engulfing candlestick pattern.
- Also read: Ripple Technical Analysis – 2-October-2024
Please note that if the USD/JPY falls below the 50-period SMA, the consolidation phase can extend to the 100-period SMA, backed by the ascending trendline at approximately 143.
USDJPY Support and Resistance Levels – 3-October-2024
Traders and investors should closely monitor the key levels below to make informed decisions and adjust their strategies accordingly as market conditions shift.
- Support: 144.5 / 141.5 / 139.5
- Resistance: 146.8 / 149.4