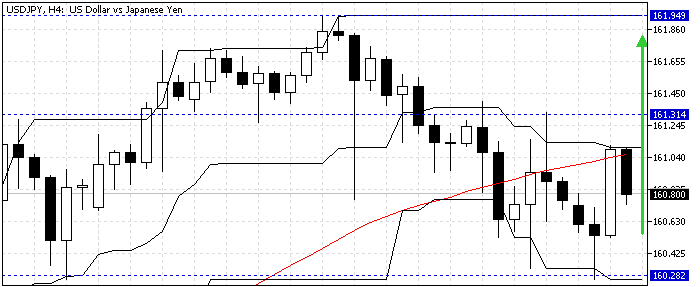
The U.S. Dollar dipped against the Japanese Yen to 160.2 last week amid concerns about BOJ intervention to increase interest rates. As of this writing, the USD/JPY currency pair trades at about 160.8, testing the 50-period simple moving average as immediate resistance.
The chart below demonstrates the key support and resistance levels and the technical indicators utilized in today’s analysis.

USDJPY Technical Analysis – 8-July-2024
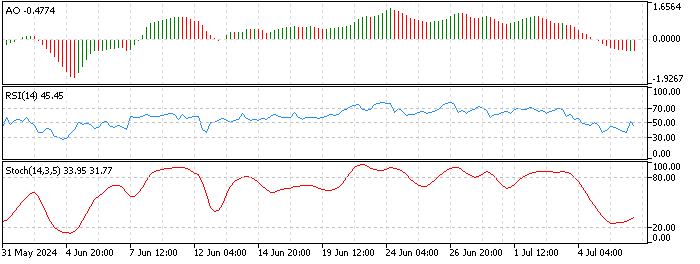
The technical indicators in the 4-hour chart suggest the market is bearish. But, the USD/JPY price is still above the 100-period simple moving average, meaning the bull market is still valid.

- The awesome oscillator value is -0.47, and red bars below the signal line indicate that the bearish trend should prevail.
- The relative strength index value suggests a neutral market because it is clung to the median line.
- The stochastic oscillator returns from the 20 level, depicting 31 in the %K value, indicating the downtrend is losing momentum.
USDJPY Price Forecast – 8-July-2024

The key resistance level is at 160.2. As long as this level holds, the primary trend should be bullish despite the Awesome oscillator’s bearish signal.
That said, if the price holds above 160.2, the USD/JPY rate will likely surge and test July’s all-time high at 161.9. However, for this scenario to come into play, bulls (buyers) should close a candle above the immediate resistance at 161.3.
USDJPY Bearish Scenario – 8-July-2024
As mentioned earlier, the immediate resistance is at 160.2. If the bears (sellers) dip the price below this level, the decline from 161.9 could extend to lower support levels.
In this scenario, the 100-period simple moving average at 159.8 could be the first target, and if the Yen’s value exceeds this level against the dollar, the next support level is at 158.7, the June 24 low.
USDJPY Key Levels – 8-July-2024
Traders and investors should closely monitor the key levels below to make informed decisions and adjust their strategies accordingly as market conditions shift.
- Support: 160.2 / 159.8 / 158.7
- Resistance: 161.3 / 161.9
Disclaimer: This technical analysis is for informational purposes only. Past performance is not necessarily indicative of future results. Foreign exchange trading carries significant risks and may not be suitable for all investors. Always conduct your research before making any investment decisions.