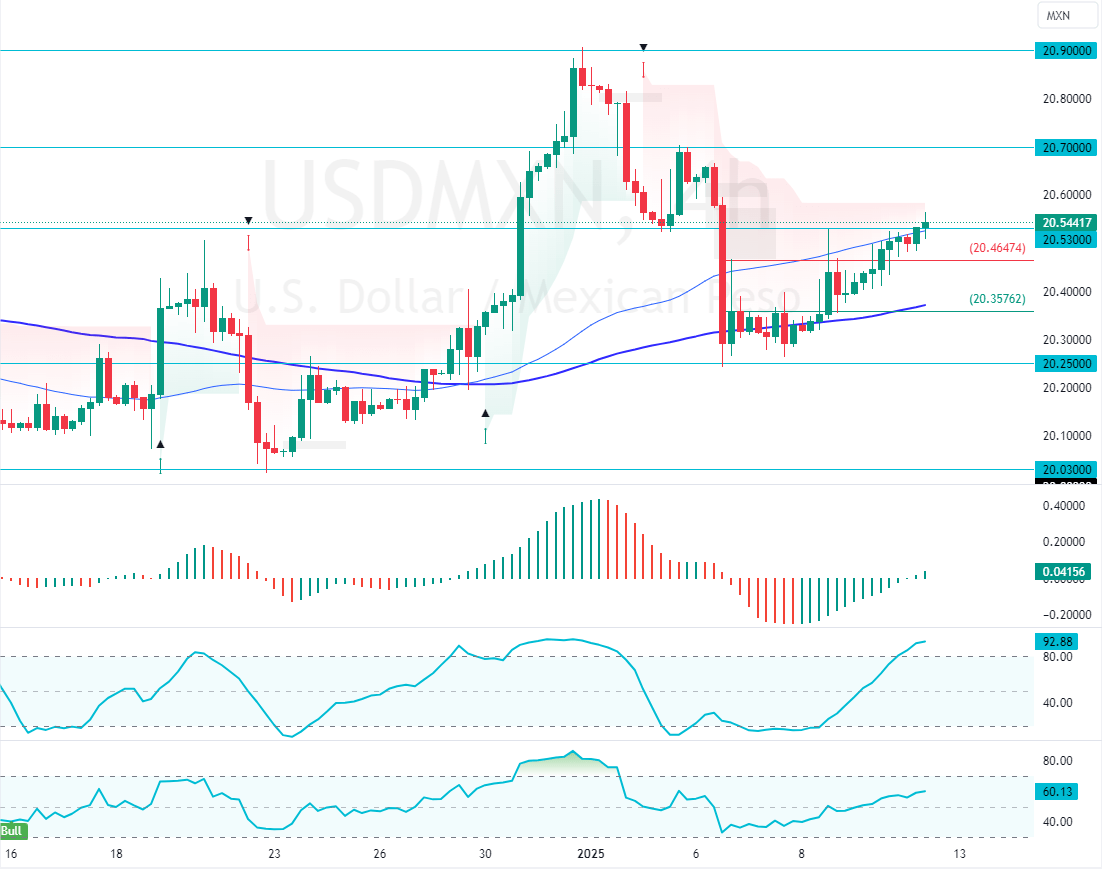
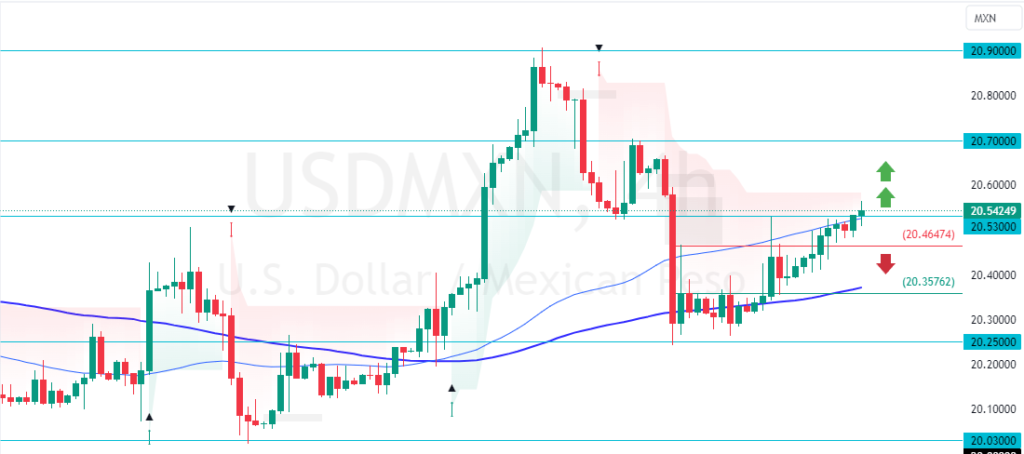
USDMXN breaks above 20.53 resistance in continuation of its bullish trend. However, the Stochastic Oscillator signals overbought. If bulls keep the currency pair’s value above the 20.46 support, the next bullish target could be 20.70.
USDMXN Technical Analysis – 10-January-2025
FxNews—The American dollar has been in a bull market, above the 50- and 100-period simple moving average, and has gained 1.50% since Monday, January 6.
As of this writing, USD/MXN trades at approximately 20.54, breaking above the immediate resistance.
What Do Technical Indicators Reveal?
- The RSI 14 value is 58, which is not overbought, meaning the uptrend could resume
- The Stochastic Oscillator value is 91.0, meaning the American dollar is saturated from buying pressure, and the prices could reverse or consolidate from this point.
- The Awesome Oscillator histogram is green, above zero, interpreted as the bull market should prevail.
Overall, the technical indicators suggest that while the primary trend is bullish, and should resume after a minor consolidation.
USDMXN Breaks Above 20.53: What’s Next?
Please note that going long or short in a market that is overwhelmed with buyers or sellers is risky. The stochastic Oscillator hovering in overbought territory gives this signal. That said, retail traders and investors should wait patiently for the currency pair to start and end its consolidation phase, which could lead to a lower support level.
The immediate support is at 20.46. From a technical perspective, USD/MXN could dip to 20.35 if bears push the prices below 20.46. This level has the potential to offer a decent bid to join the bull market.
Furthermore, if 20.35 holds, the next bullish target for USD/MXN traders will likely be the 20.70 mark. Please keep in mind that a break below the 20.35 support invalidates the bull market.
- Also read: Bearish GBPUSD is oversold at 1.231
The Bearish Scenario
The immediate is at 20.46. From a technical standpoint, a new bearish wave will likely form if the value of USD/MXN falls below 20.46. In this scenario, the prices could fall toward the 20.35 support, backed by the 100-period simple moving average.
USDMXN Support and Resistance Levels – 10-January-2025
Traders and investors should closely monitor the USD/MXN key levels below to make informed decisions and adjust their strategies accordingly as market conditions shift.
| USDMXN Support and Resistance Levels – 10-January-2025 | |||
|---|---|---|---|
| Support | 20.46 | 20.35 | 20.25 |
| Resistance | 20.53 | 20.70 | 20.9 |


