FxNews—The U.S. Dollar has been losing ground against the Mexican peso since August 5 from the 20.21 mark. The downtrend eased after the USD/MXN price hit the 38.2% Fibonacci retracement level at 18.80, and as a result, the price bounced, currently trading at about 18.95.
The dip in the currency pair’s value was predicted by the ABCD harmonic pattern. Since the ABCD pattern emerged in a higher time frame, in this case, the daily chart, the downtrend will likely resume to lower targets, as depicted in the daily chart below.

USDMXN Technical Analysis – 14-August-2024

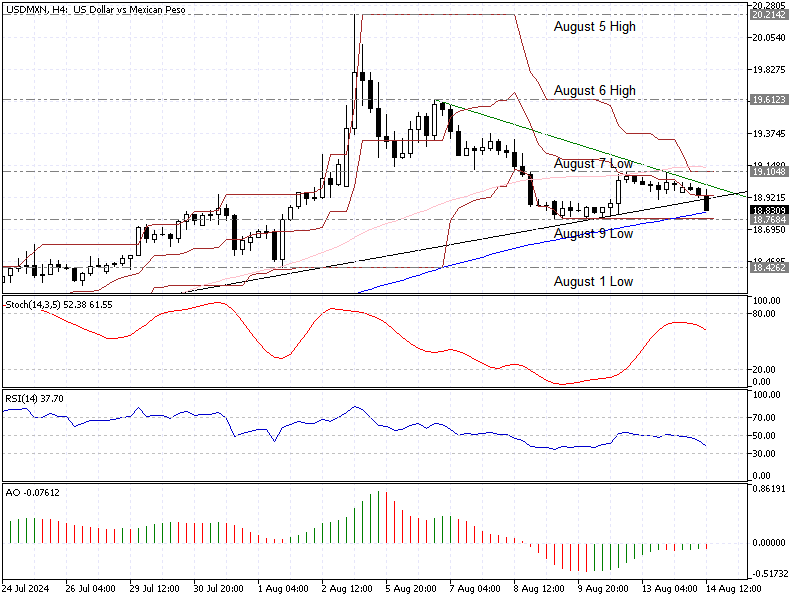
We zoom into the 4-hour chart to examine the price action and the technical indicators utilized in today’s analysis more closely. The USD/MXN price is above the 100-period simple moving average, indicating the primary trend is bullish despite the recent robust selling pressure. Other technical indicators suggest the bears (sellers) are gaining strength, and the bull market is losing momentum.
- The awesome oscillator value is -0.07, hovering below the signal line, indicating a bearish trend.
- The relative strength index value is 38, approaching 30 lines, meaning the trend is bearish. However, the market has not been oversold yet so that the decline could resume.
- The stochastic oscillator gives a different signal. Its value is 53, indicating that the market lacks any significant trend and is moving sideways or consolidating some of its recent losses.
USDMXN Forecast – 14-August-2024

The currency’s price is below the descending trendline, approaching the apex of the symmetrical triangle. The immediate support rests at the August 9 low, the 18.76 mark—the 100-period simple moving average backs this level.
From a technical perspective, if the bears (sellers) close and stabilize the price below 18.768, the downtrend will likely resume. In this scenario, the next bearish target will be the August 1 low at 18.42. Furthermore, if the selling pressure exceeds 18.42, the July 19 high at 18.11 will be the next supply zone.
Please note that the immediate resistance is at 19.10. If the price exceeds this level, the bearish outlook should be invalidated.
- Also read: USD/HKD Forecast – 14-August-2024
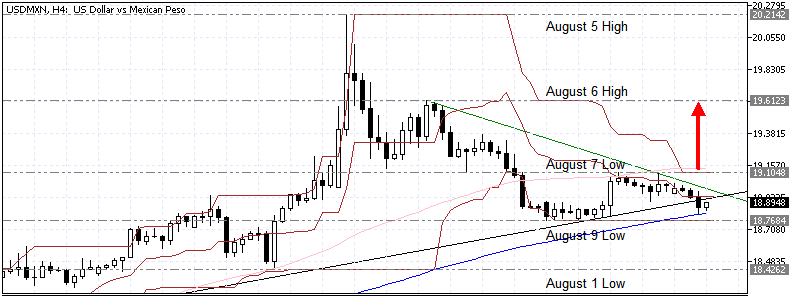
USDMXN Bullish Scenario – 14-August-2024

The immediate resistance is the August 7 low at 19.10. If the bulls (buyers) close and stabilize the price above this barrier, the next bullish target will likely be the August 6 high at 19.61. Furthermore, if the price exceeds 19.61, the best barrier for buyers will be the August 5 high of 20.21.
Notably, the bullish outlook should be invalidated if the price dips below the 18.76 support.
USDMXN Support and Resistance Levels – 14-August-2024
Traders and investors should closely monitor the key levels below to make informed decisions and adjust their strategies accordingly as market conditions shift.
- Support: 18.76 / 18.42 / 18.11
- Resistance: 19.10 / 19.61 / 20.21
Disclaimer: This technical analysis is for informational purposes only. Past performance is not necessarily indicative of future results. Foreign exchange trading carries significant risks and may not be suitable for all investors. Always conduct your research before making any investment decisions.