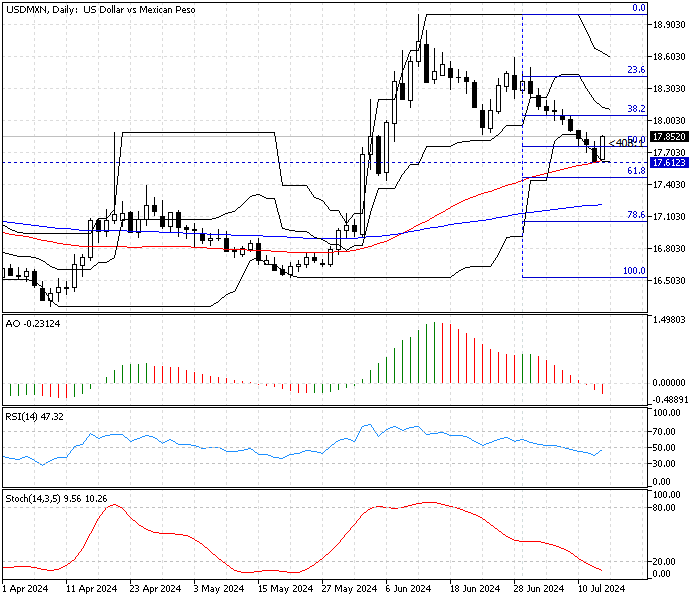
FxNews–The U.S. Dollar has been in a bear market against the Mexican Peso. As of writing, the USD/MXN pair trades at about 17.83, bouncing from the daily 50-period simple moving average, the 17.61 mark. The pullback from the daily 50 SMA was expected because the stochastic is in oversold territory in the daily chart, as shown in the image below.

USDMXN Technical Analysis – 15-July-2024
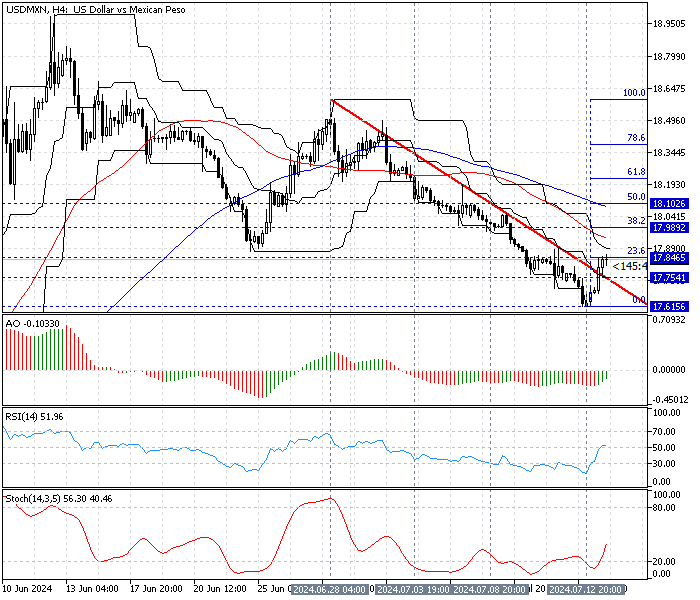
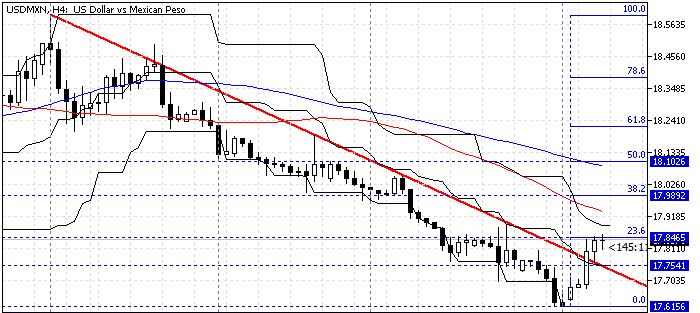
We zoom into the 4-hour chart to analyze the price action and the key technical indicators in detail. The bounce from 17.61 resulted in the bulls breaking the descending trendline, which had been intact since June 28. However, the buyers face the immediate resistance level at 23.6% Fibonacci, the 17.84 mark, a demand zone that might keep the price from rising.
The technical indicators in the USD/MXN 4-hour chart suggest the bear market is weakening and the bull market is strengthening, but the primary trend is still bearish.

- In the 4-hour chart, the price is below the 50- and 100-period moving average, which shows a robust bear market.
- The awesome oscillator bars are below the signal line, but they have changed colors to green. The AO’s recent value is -0.1 in the description and is rising, meaning the bull market is strengthening.
- The relative strength index indicator has crossed above the median line, meaning the market is not overbought nor oversold, and today’s bullish momentum could extend to the next resistance level.
- The Stochastic oscillator stepped outside the oversold territory, and the %K line value rose, which means the buyers gained more momentum.
USDMXN Forecast – 15-July-2024

The immediate resistance is at 17.84, which aligns with the 23.6% Fibonacci retracement level. Since the primary trend is bearish, the current uptick momentum should be considered a consolidation phase, during which the U.S. Dollar tries to erase some of its recent losses against the Mexican currency.
That said, from a technical perspective, if the bulls (buyers) cross and stabilize the price above the 23.6% Fibonacci, the USD/MXN value could rise to test the 38.2% Fibonacci at 17.98, which aligns with the July 8 low. Furthermore, if the price exceeds 17.98, the next barrier will be the 50% Fibonacci at 18.1, backed by the 100-period SMA and the July 3 low.
Please note if the consolidation scenario should be invalidated if the USD/MXN price dips below the immediate support at 17.75.
USD/MXN Bearish Scenario
The key resistance level that prevents the price from further decline is the July 12 low at 17.61. If the bears (sellers) close and stabilize the price below this mark, the downtrend that began on June 28 will likely extend to 17.47.
Please note that the bear market is invalidated if the USD/MXN bulls exceed the exchange rate above the %50 Fibonacci at 18.1, a resistance zone backed by the 100-period SMA.
USDMXN Key Levels – 15-July-2024
Traders and investors should closely monitor the key levels below to make informed decisions and adjust their strategies accordingly as market conditions shift.
- Support: 17.75 / 17.61 / 17.47
- Resistance: 17.84 / 17.98 / 18.1
Disclaimer: This technical analysis is for informational purposes only. Past performance is not necessarily indicative of future results. Foreign exchange trading carries significant risks and may not be suitable for all investors. Always conduct your research before making any investment decisions.