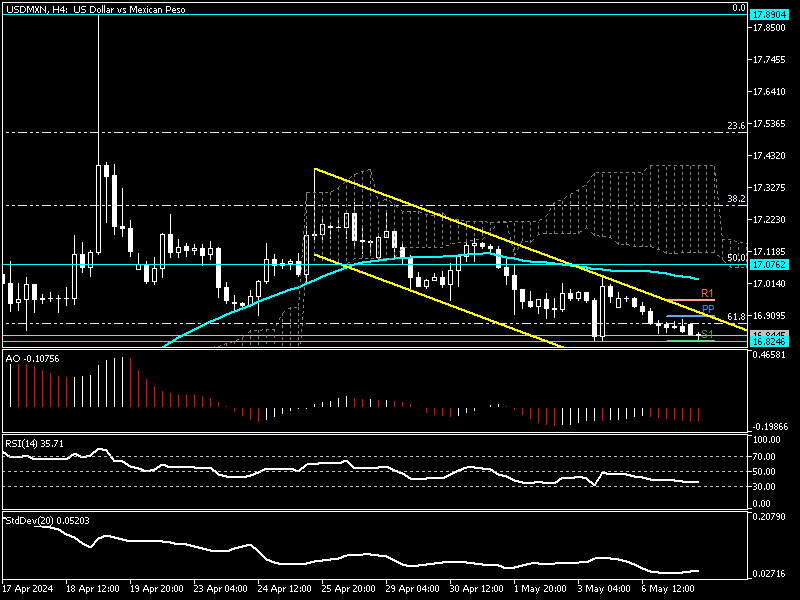
The Mexican Peso pushed the U.S. Dollar into a steep downtrend after the pair peaked at the 17.8 mark on April 19. As of writing, the USDMXN trades at about 16.8, approaching the EMA 50, as shown in the daily chart below.

The U.S. dollar resisted declining after reaching as low as 16.82 on May 3; consequently, the chart formed a long-wick bullish candlestick pattern. This pattern brought hope to bullish traders, but the momentum didn’t last long. The downtrend resumed on Monday, and as of writing, the pair trades at about 16.82, close to its lowest point since April 17th.
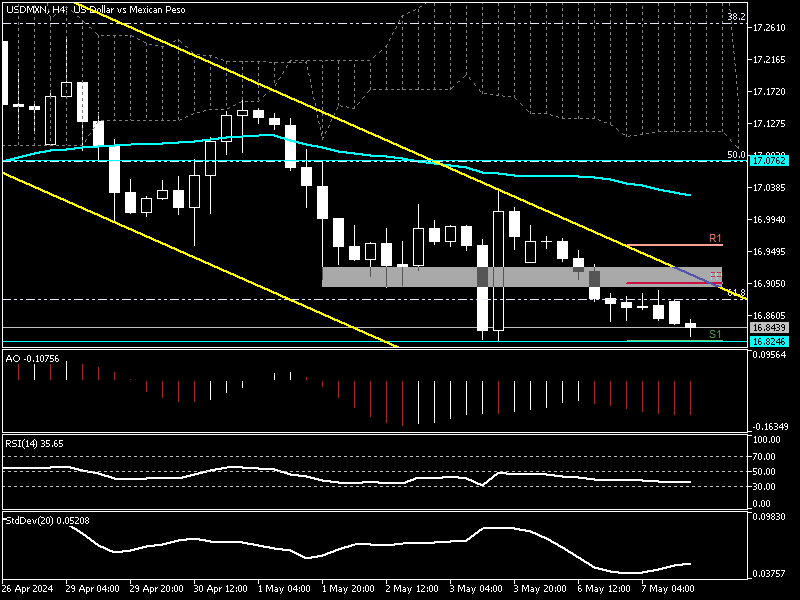
The long-wick candlestick mentioned in the paragraph above is highlighted in grey in the daily chart above. Like in all our previous technical analyses, we zoom into the 4-hour chart to mark key levels and forecast the next USDMXN move.
Technical Indicators Point to Bearish Sentiment in USDMXN

Extreme selling pressure drove the pair below the Ichimoku cloud, a trend direction indicator. Since the price hovers below the Ichimoku cloud and EMA 50, we know we are in a bear market. The other technical indicators signal a continuation of the downtrend, with the RSI hovering below 50 and the awesome oscillator bars in red.
USDMXN Forecast – The Downtrend Persists
From a technical standpoint, the USDMXN market is bearish and is testing the 16.82 resistance. If the price dips below 16.82, the downtrend will likely escalate and expand to 16.61, a support area backed by the lower line of the flag and the %78.6 Fibonacci. Therefore, the bearish market might ease around the 16.61 mark.
Factors that Invalids The Bearish Technical Analysis

If the 16.82 level holds, the USDMXN will likely experience a consolation phase. But for this scenario to come into play, the price must close and stabilize itself above the upper band of the flag, as shown in the image above. In this case, the price will likely soar to the Ichimoky cloud, coinciding with the %50 Fibonacci, the 17.07 mark.
It is worth noting that the awesome oscillator signals divergence. Therefore, traders and investors must watch today’s pivot, the 16.90 mark, and the 16.82 resistance. This is a very narrow-range trading zone, and if the price breaks any of them, it can potentially move the market to its next milestone.
USDMXN Key Support and Resistance Zones
- Resistance: 16.95, 17.07
- Pivot: 16.90
- Support: 16.82, 16.77, 16.61