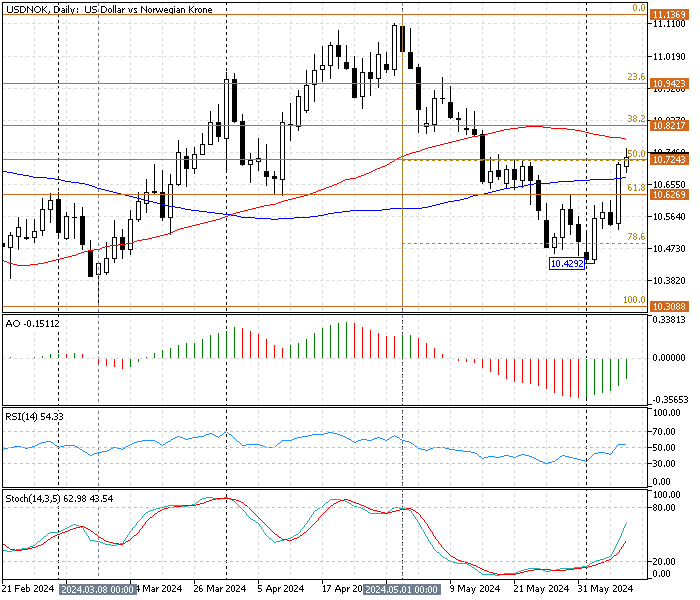
FxNews—The U.S. Dollar tests the %50 Fibonacci level at approximately 10.72 against the Norwegian Krone in today’s trading session.
The USD/NOK daily chart below demonstrates the price action, the Fibonacci retracement levels, and the technical indicators utilized in today’s technical analysis.
USD/NOKAnalysis Daily Chart
The currency pair experienced a pullback from the 10.42 mark. The bullish momentum escalated after the price crossed above the 61.8% Fibonacci at 10.62, and as of this writing, the bulls are struggling with the 10.72 barrier.
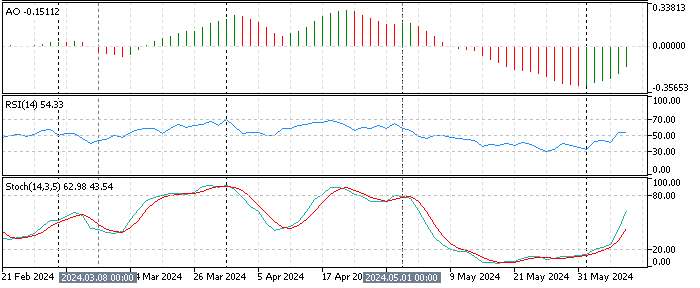
The technical indicators in the USD/NOK daily chart suggest the uptrend should resume.
- The awesome oscillator value is -0.15 and increasing. The bars are green but below the signal line. This growth in the AO value suggests that the bearish momentum is weakening.
- The relative strength index value is 54, flipped above the median line today, signifying the bullish trend is strengthening.
- The stochastic oscillator stepped outside the oversold territory today and currently depicts 43 and rising, meaning the uptrend can resume, and the U.S. price has room to grow because it has not been overbought yet.
USDNOK Technical Analysis – 10-June-2024
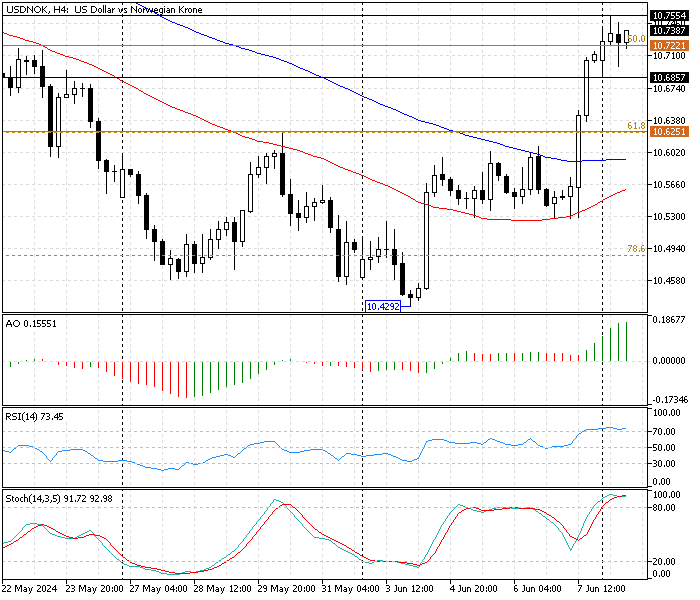
The 4-hour chart provides a detailed overview of the price action. At first glance, the momentum indicators appear overbought.
- The RSI (14) value is 72, signaling that the uptrend could ease and that we might witness a pullback soon.
- The stochastic oscillator %K value is 90 and crosses the %D period from above. This development in the indicator interprets that the USD/NOK pair is currently overpriced in the short term, and the trend might reverse or test lower support levels.
- The awesome oscillator bars are green and tall, recording 0.15 in the description, meaning the primary trend is bullish and prevails.
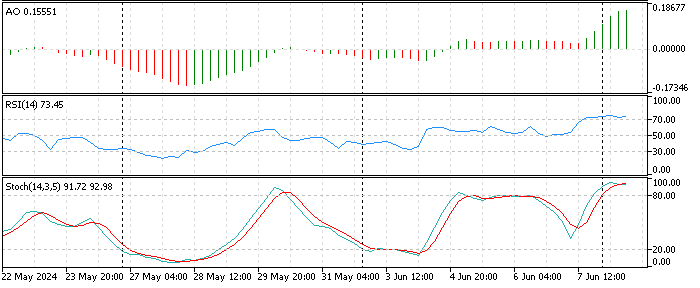
These developments in the technical indicators in the USD/NOK 4-hour chart suggest the primary trend is bullish. Still, investors and traders should cautiously approach the bull market because the technical tools signal a consolidation or trend reversal.
USDNOK Forecast – 10-June-2024
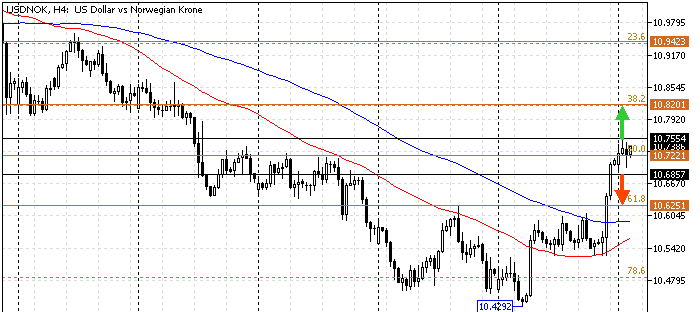
As mentioned earlier, the technical indicators show the U.S. Dollar is overpriced against the Norwegian Krone. That said, we suggest waiting patiently for the currency pair to go through its consolidation phase. In this scenario, the price might dip below the immediate support at 10.68. If this critical event occurs, the correction phase could target the 61.8% Fibonacci level at 10.62.
Important Note: The immediate support at 10.67 and the key support at 10.62 provide a decent entry point with a reasonable risk of joining the bull market. Hence, traders and investors should monitor these levels for bullish candlestick patterns such as a doji, a hammer candlestick, or a bullish engulfing pattern.
USD/NOK Bullish Scenario
The immediate support is at 10.68. For the bullish trend to resume, the price must stay above this and 50% Fibonacci levels. If this scenario unfolds, the next bullish target could be the 38.2% Fibonacci at 10.82.
The simple moving average of 100 supports this bullish scenario. The uptrend should be invalidated if the USD/NOK price dips below the SMA 100.
USD/NOK Key Support and Resistance Levels
Traders and investors should closely monitor the key levels below to make informed decisions and adjust their strategies accordingly as market conditions shift.
- Support: 10.68 / 10.625
- Resistance: 10.75 / 10.82
Disclaimer: This technical analysis is for informational purposes only. Past performance is not necessarily indicative of future results. Foreign exchange trading carries significant risks and may not be suitable for all investors. Always conduct your research before making any investment decisions.