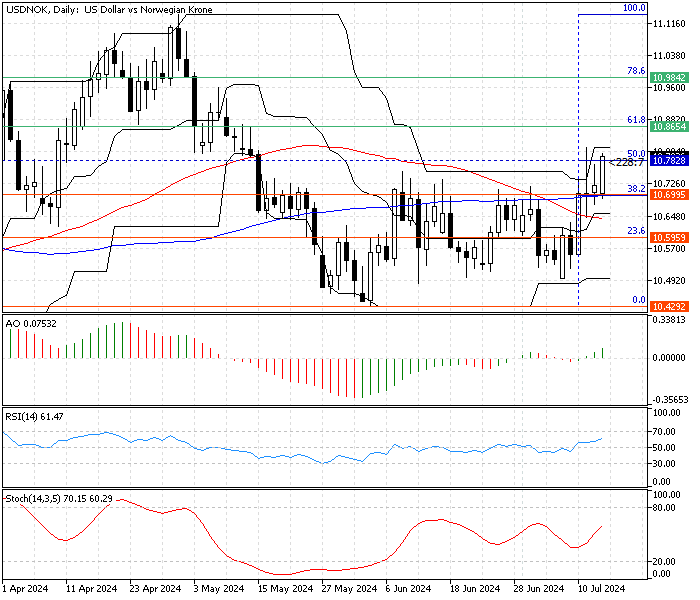
FxNews—The American currency broke out from sideways trading in today’s trading session against the Norwegian Krone. As of writing, the USD/NOK pair trades at about 10.78, slightly above the 50% Fibonacci retracement level.
The USD/NOK daily chart below shows the price, key support and resistance levels, and the technical indicators utilized in today’s analysis.

USDNOK Technical Analysis – 15-July-2024
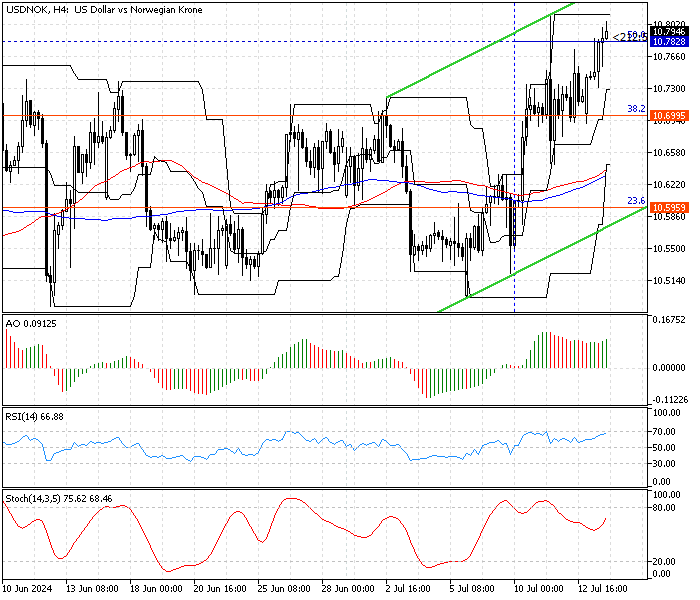
We zoom into the 4-hour chart to analyze the price action and the technical indicators in detail. As the image below demonstrates, the U.S. dollar is in an uptrend against the Norwegian currency because the price is above the 50- and 100-period simple moving average, and it is expected to grow higher.

- The awesome oscillator value is 0.09 with green bars above the signal line, meaning the bull market prevails.
- The relative strength index value is 66, approaching overbought territory. This indicates that the market is not overbought and that the uptrend could resume.
- The stochastic oscillator value is rising, with the %K value hovering at 68, aligning with the RSI (14). This shows that the market is not saturated from the buying pressure yet and can resume.
USDNOK Forecast – 15-July-2024

The key resistance level for the bull market is the 23.6% Fibonacci at 10.42, backed by the 100-period simple moving average and the ascending trendline. The 4-hour chart shows that the current price (10.78) is far from the key resistance, but traders should note that the trend can be considered reversed from a bull market to a bear market only if the sellers push the price below 10.42.
That said, the next bullish target could be the 61.8% Fibonacci at 10.86, in conjunction with the upper line of the bullish flag. Furthermore, if the buying pressure exceeds 10.86, the bulls’ road to the 78.6% Fibonacci at 10.98 will likely be paved.
USD/NOK Bearish Scenario
As mentioned earlier, the key resistance level is at the 23.6% Fibonacci level, the 10.42 mark. But if the price dips below the 38.2% Fibonacci level at 10.69, the decline can result in the price testing the 10.42 key resistance, a level backed by the ascending trendline.
USDNOK Key Levels – 15-July-2024
Traders and investors should closely monitor the key levels below to make informed decisions and adjust their strategies accordingly as market conditions shift.
- Support: 10.69 / 10.59
- Resistance: 10.86
Disclaimer: This technical analysis is for informational purposes only. Past performance is not necessarily indicative of future results. Foreign exchange trading carries significant risks and may not be suitable for all investors. Always conduct your research before making any investment decisions.