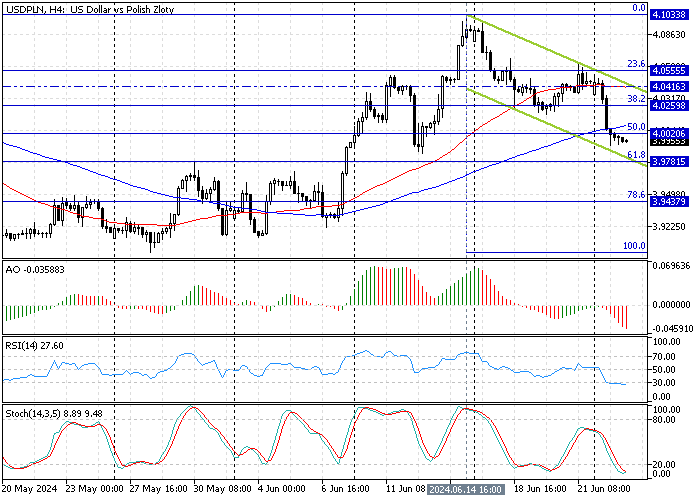
FxNews—The American currency has been dipping against the Polish Zloty since June 14, trading inside the bearish flag in the 4-hour chart. As of writing, the USD/PLN currency pair trades at 3.99, stabilizing below the 100-period moving average and the 50% Fibonacci level at 4.0.
The 4-hour chart below shows the USD/PLN key Fibonacci levels, as well as the current price and the technical indicators utilized in today’s analysis.

USDPLN Technical Analysis – 25-June-2024

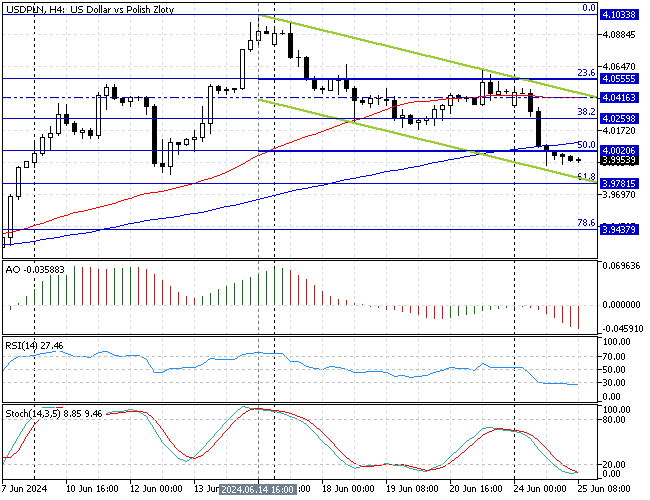
The robust selling pressure, which began from 4.1 on June 16, eased near the lower line of the bearish flag at approximately 3.99. This development in the Polish Zloty price against the dollar has driven RSI 14 and the stochastic oscillators into the oversold territory.
- The awesome oscillator value is -0.035 and declining. The AO bars are red and below the signal line, which means the downtrend prevails.
- The relative strength index indicator value is 27, which is inside the oversold territory, signifying that the Polish Zloty is overpriced in the short term.
- The stochastic oscillator aligns with the RSI 14. The indicator value is nine and deep in the oversold area, suggesting the market is oversold, and the price might bounce from this point.
In conclusion, the technical indicators in the USD/PLN 4-hour chart suggest the primary trend is bearish, but the market is oversold and could start consolidating.
USDPLN Forecast – 25-June-2024

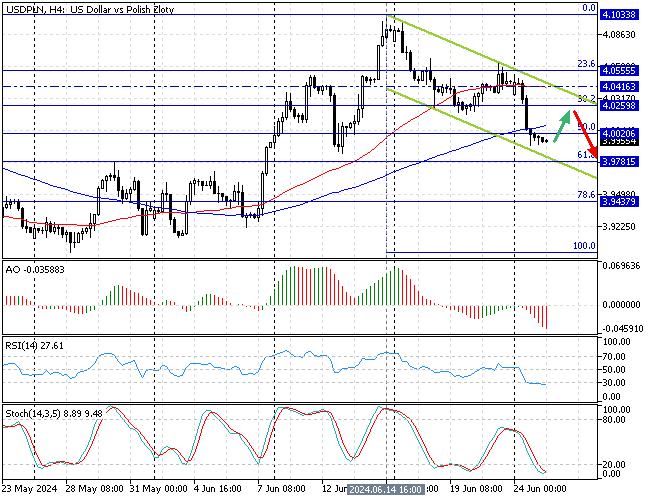
The %50 Fibonacci level and the 100-period simple moving average at approximately 4.0 is the immediate resistance to the current downtrend. If the price exceeds 4.0, the stochastic and RSI oversold signal could come into play, and the price might see an uptick in momentum to the upper line of the bearish flag at approximately 4.04.
Furthermore, if the buying pressure exceeds 4.04, the next target could be the 23.6% Fibonacci at 4.05. Please note that the trend should be considered reversed if the USD/PLN price exceeds 4.05.
USD/PLN Bearish Scenario
According to RSI 14 and the Stochastic oscillator (14, 3, 5), the USD/PLN market is oversold, meaning it is not recommended to join the bear market. Traders and investors should wait patiently for the market to consolidate near the 38.2% Fibonacci at 4.02 and 4.04. These two demand areas provide a decent entry point for sellers to join the downtrend.
Please note that traders must monitor the key resistance levels for bearish signals, such as overbought momentum indicators or bearish candlestick patterns, to confirm before executing a sell order.
If the bearish scenario comes into play, the downtrend will likely resume, targeting the 61.8% Fibonacci at 3.97. Likewise, if the selling pressure exceeds 3.97, the next supply zone could be the 78.6% Fibonacci at 3.94.
USD/PLN Key Support and Resistance Level
Traders and investors should closely monitor the key levels below to make informed decisions and adjust their strategies accordingly as market conditions shift.
- Support: 3.97 / 3.94
- Resistance: 4.0 / 4.025 / 4.041 / 4.055
Disclaimer: This technical analysis is for informational purposes only. Past performance is not necessarily indicative of future results. Foreign exchange trading carries significant risks and may not be suitable for all investors. Always conduct your research before making any investment decisions.