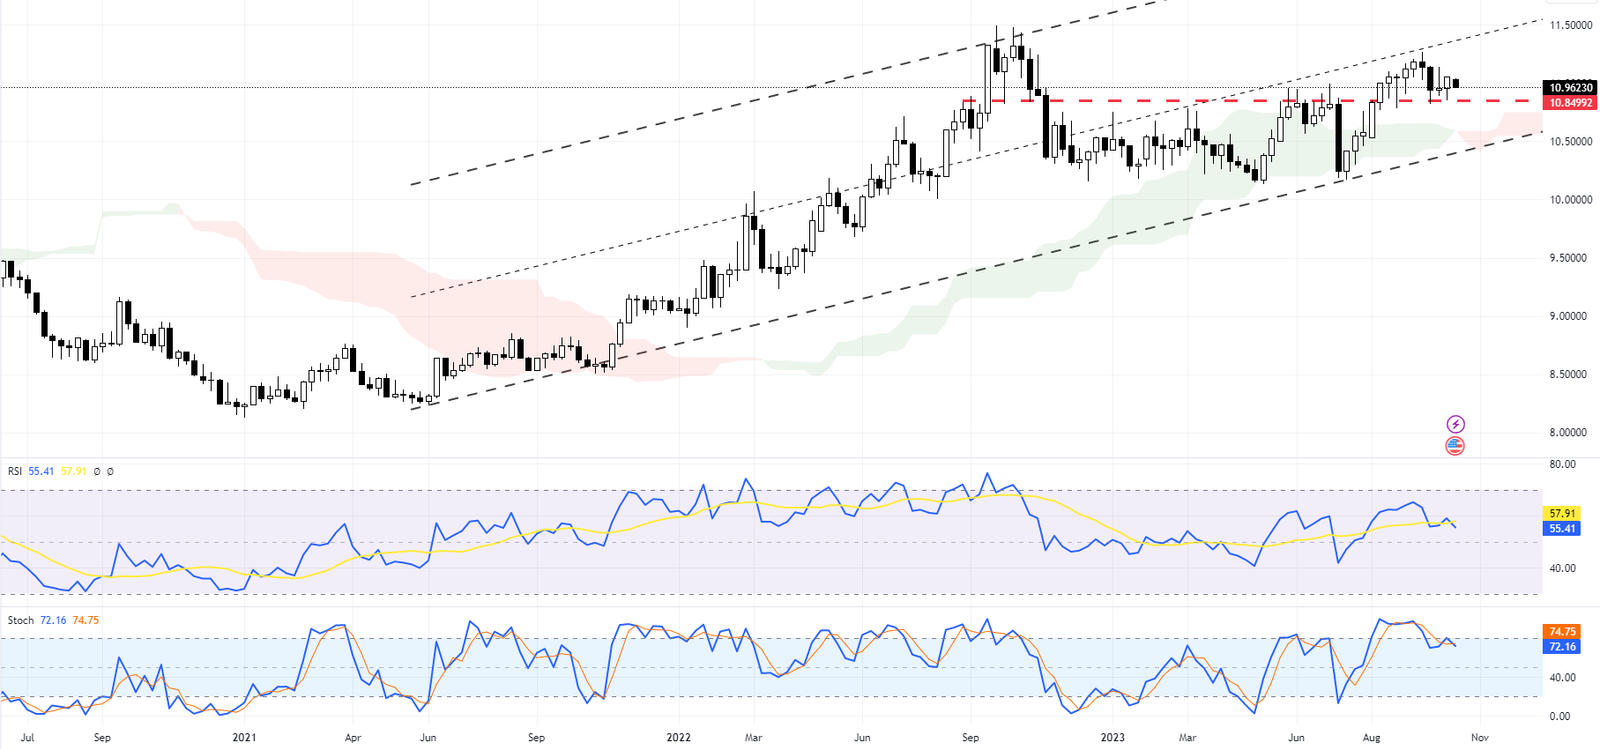
FxNews – In our latest USDSEK analysis, we’ve observed that the USDSEK is gaining value and trading within a bullish channel.
The cornerstone of any forex analysis is identifying the trend of the asset you’re planning to trade. We can better understand the current market condition by examining the weekly or daily chart. Is it in a bullish phase, or is it bearish? Stay tuned for our comprehensive forex trend analysis.
USDSEK Analysis – The Ultimate Guide to October 2023

The pair recently broke above the 10.84 resistance level, a significant milestone in its upward trajectory. This break was tested when the Stochastic oscillator signaled that the USDSEK might be overbought. However, the RSI indicator remaining above the 50 level and far from the overbought area suggests a decent buyer bid at the 10.84 support level.
USDSEK Analysis – The Ultimate Guide to October 2023: 4H Chart

We’ve zoomed into the USDSEK 4H chart to confirm this scenario further. Despite the bulls’ attempts to break out of the bearish channel, the USDSEK price has returned inside the channel. In this USDSEK analysis, we recommend traders exercise patience at this level. Although the currency pair’s main trend is bullish in the weekly chart, it’s currently in a declining channel in the 4H chart.
USDSEK Forecast
If the bears close below the blue bullish channel, we anticipate that the USDSEK price will decline to the middle line of the 4H bearish channel (shown in black) and reach the 10.77 support level. On the other hand, if the USDSEK bulls manage to break out of the blue bullish channel in the 4H chart, we predict that the pair’s price will surge toward a target of 11.123.