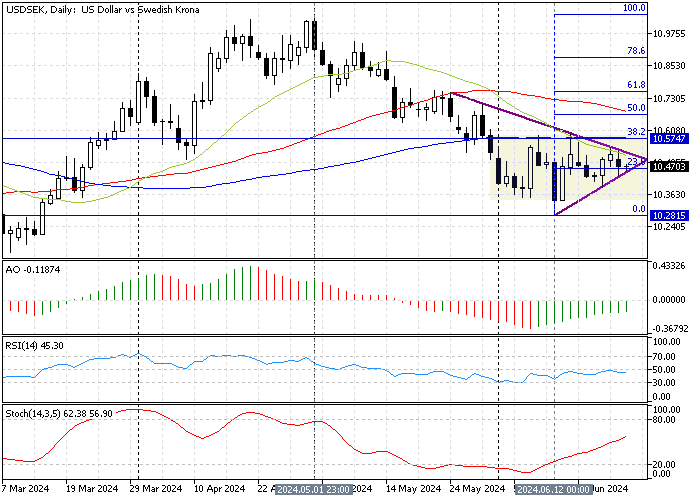
FxNews—The USD/SEK currency pair is in a bear market, trading below the 25-period simple moving average in the daily chart. As of this technical analysis, the U.S. dollar trades below the 10.57 key resistance at about 10.46, slightly above the 23.6% Fibonacci support.
The USD/SEK daily chart below demonstrates the currency’s current exchange rate, the symmetrical triangle pattern, and the key technical tools utilized in today’s forecast.

USDSEK Technical Analysis – 25-June-2024
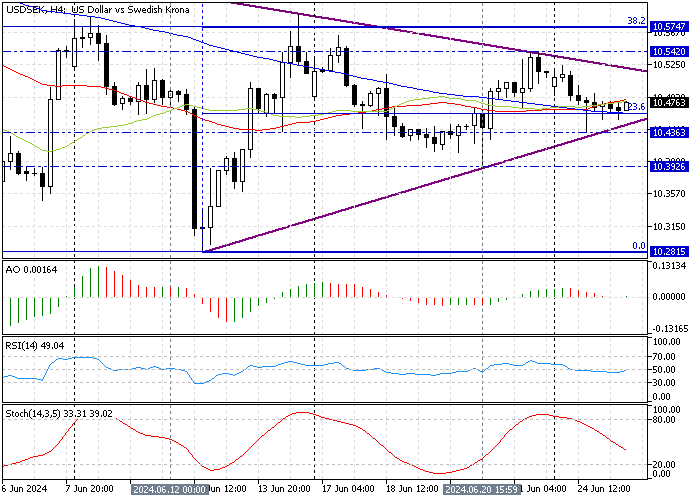
We zoomed into the 4-hour chart to examine the price action and technical indicators more closely. The diagram below shows the USD/SEK price nearing the apex of a symmetrical triangle, which could cause the price to escape from one side. The technical indicators in the 4-hour diagram suggest the market lacks momentum and has a mild bearish outlook.

- The awesome oscillator bars cling to the signal line, signifying that the market is moving sideways and is neither bullish nor bearish.
- The relative strength index indicator is below the median line but moving alongside it. The RSI (14) depicts 47 in value, suggesting the USD/SEK trend is slightly bearish in the current trading session.
- The stochastic oscillator declines, recording 38 in the %K line value. This development in the stochastic indicators suggests the market is not oversold, and the existing downtrend could extend.
USDSEK Forecast – 25-June-2024

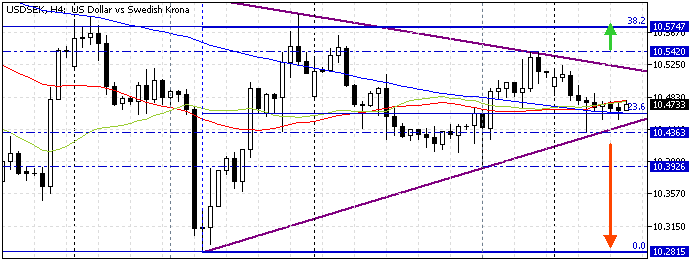
The immediate resistance is at 10.46, backed by the ascending trendline in the 4-hour chart. The downtrend will probably resume because of the technical indicators signaling a bear market.
In the bearish scenario, the USD/SEK price must dip below the immediate support at 10.43. If this strategy unfolds, the decline that began on June 21 could target the June 20 low at 10.39. Furthermore, if the selling pressure exceeds 10.39, the Swedish Krona will aim for the 10.281 mark against the U.S. Dollar.
The 38.2% Fibonacci retracement level at 10.57 is the key resistance to the bearish strategy.
USD/SEK Bullish Scenario
Since the pair trades sideways in a narrow range area, approaching the apex of the symmetrical triangle, the uptick momentum could test the upper resistance levels.
For this scenario to play out, the bulls first must close and stabilize the price above the descending trendline at about 10.54. If this occurs, the 38.2% Fibonacci retracement level will be the next target. Please be aware that if the buying pressure exceeds 10.57, the trend should be considered bullish, and the path to the %50 Fibonacci retracement level at 10.66 will likely be paved.
The 10.43 is the support to the bullish scenario. Should the sellers breach the level, the bullish strategy should be invalidated accordingly.
USDSEK Key Support and Resistance Levels
Traders and investors should closely monitor the key levels below to make informed decisions and adjust their strategies accordingly as market conditions shift.
- Support: 10.43 / 10.39 / 10.28
- Resistance: 10.54 / 10.57 / 10.66
Disclaimer: This technical analysis is for informational purposes only. Past performance is not necessarily indicative of future results. Foreign exchange trading carries significant risks and may not be suitable for all investors. Always conduct your research before making any investment decisions.