FxNews—The U.S. Dollar trades in a bear market against the Swedish Krona at approximately 10.24. Yesterday, the pair tested the June 2024 low (10.34), and as a result, the downtrend resumed.
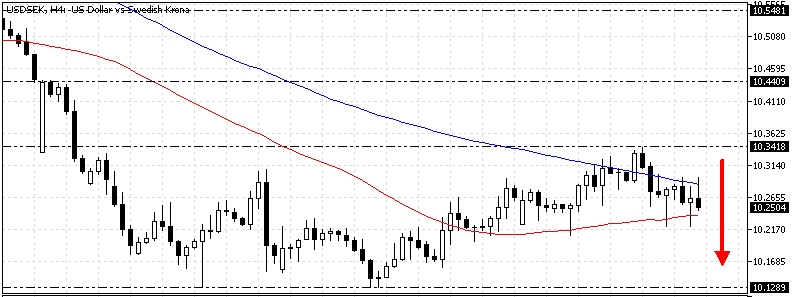
The USD/SEK daily chart below demonstrates the price, the key support and resistance levels, and the technical indicators utilized in today’s analysis.

USDSEK Technical Analysis – 5-September-2024

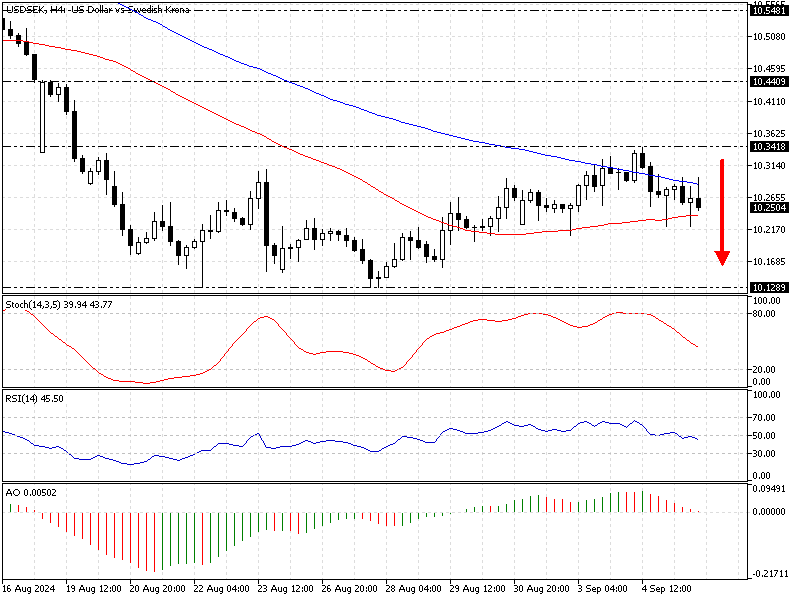
Zooming into the 4-hour chart, we notice the price is below the 100-period simple moving average, inclining the primary trend, which is bearish.
- The stochastic oscillator value is 39 and declining, meaning the bear market strengthens.
- The relative strength index value is 44 below the median line, signaling the downtrend is gaining momentum.
- Awesome oscillator bars are red and about to flip below the signal line. This development in the AO’s histogram signifies that selling pressure is rising.
Overall, the technical indicators suggest the primary trend is bearish and will likely resume at lower support levels.
USDSEK Forecast – 5-September-2024

The bulls’ critical resistance rests at the September 4 high (10.341). From a technical standpoint, the downtrend will likely continue if the USD/SEK price remains below 10.341. In this scenario, the August low at 10.128 could be initially targeted.
Furthermore, if selling pressure exceeds 10.12, the next support area will be the psychological USD/SEK level at 10.0.
Please note that the bearish scenario should be invalidated if the price exceeds the critical resistance level at 10.34 or stabilizes itself above the 100-period simple moving average.
- Also read: USD/PLN Forecast – 5-September-2024
USDSEK Bullish Scenario – 5-Septemeber-2024

The key barrier for the bulls is at 10.34. If the price exceeds this level, the uptick from 10.128 could target 10.44, followed by the August 15 high at 10.54.
The 100 SMA will be the primary support for the bullish scenario.
USDSEK Support and Resistance Levels – 5-August-2024
Traders and investors should closely monitor the key levels below to make informed decisions and adjust their strategies accordingly as market conditions shift.
- Support: 10.12 / 10.0
- Resistance: 10.34 / 10.44 / 10.58
Disclaimer: This technical analysis is for informational purposes only. Past performance is not necessarily indicative of future results. Foreign exchange trading carries significant risks and may not be suitable for all investors. Always conduct your research before making any investment decisions.