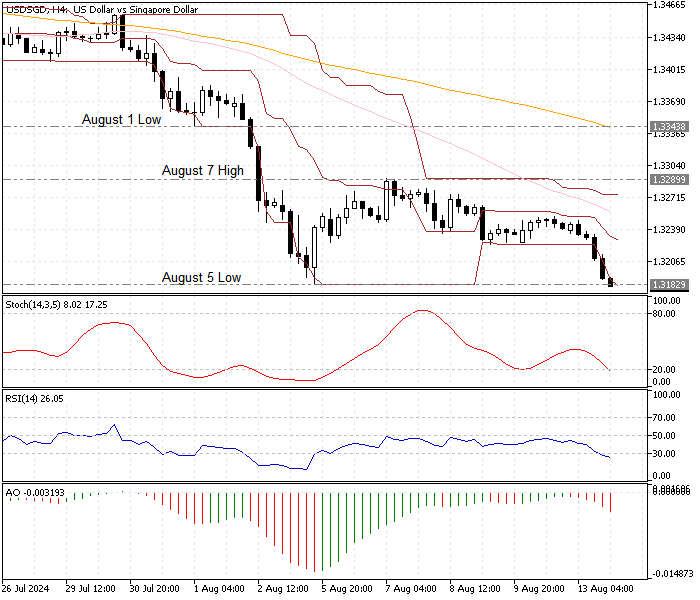
FxNews—The American dollar has been in a bear market against the Singapore dollar, trading below the 50- and 100-period simple moving averages, as depicted in the USD/SGD 4-hour chart below.

USDSGD Technical Analysis – 13-August-2024
As of this writing, the currency pair tests the August 2023 low at 1.318. Meanwhile, extreme selling pressure has driven the RSI indicator into oversold territory, meaning the USD/SGD pair is oversold.

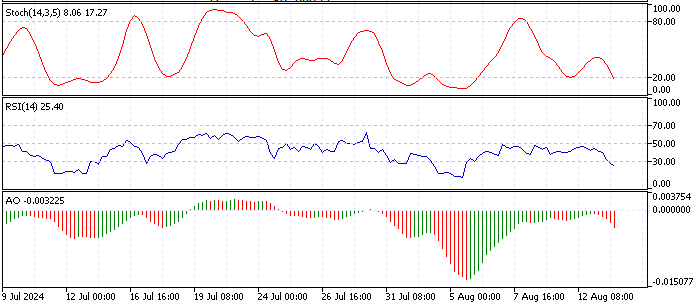
The key technical indicators suggest the primary trend is bearish, but the Singapore dollar could be overpriced against the American currency in the short term. Therefore, a consolidation phase could be on the horizon, which might result in the USD/SGD price testing the upper resistance levels.
- The awesome oscillator indicator value is -0.003, and red bars below the signal line indicate that the bear market prevails.
- The RSI and stochastic are in the oversold area, signifying an oversold market.
USDSGD Forecast – 13-August-2024

The August 5 low at 1.318 is the immediate resistance, which is under pressure now. From a technical perspective, the downtrend will be triggered if this level is breached. If this scenario unfolds, the December 12, 2024, low at 1.315 will be the next key resistance level.
Please note that the April 7 high at 1.328 plays the immediate resistance role. If the price breaks and stabilizes above 1.328, the bearish outlook should be invalidated. If this scenario occurs, the August 1 low at 1.334 will be the next key resistance area.
- Also read: USD/DKK Forecast – 12-August-2024
USDSGD Support and Resistance Levels – 13-August-2024
Traders and investors should closely monitor the key levels below to make informed decisions and adjust their strategies accordingly as market conditions shift.
- Support: 1.318 / 1.315
- Resistance: 1.328 / 1.334
Disclaimer: This technical analysis is for informational purposes only. Past performance is not necessarily indicative of future results. Foreign exchange trading carries significant risks and may not be suitable for all investors. Always conduct your research before making any investment decisions.