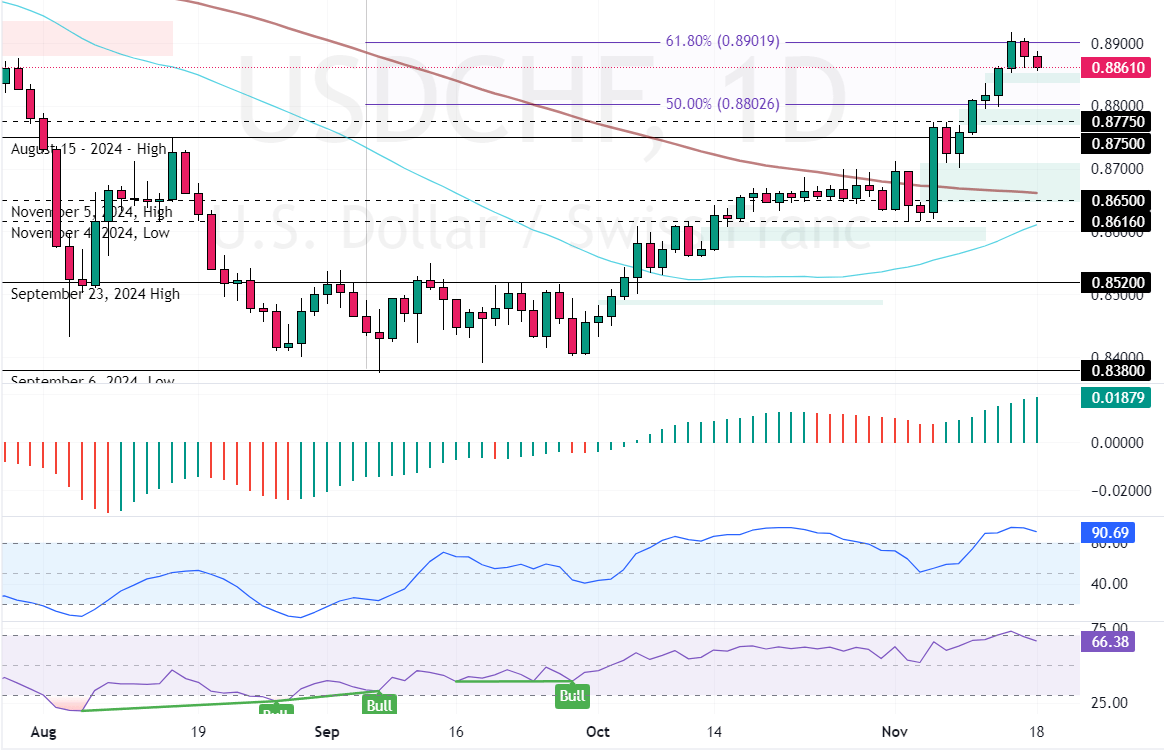
FxNews—The USD/CHF pair trades bullish, above the 50- and 100-period simple moving averages. The uptrend eased when the price peaked at the 0.890 resistance, backed by the 61.8% Fibonacci level.
As of this writing, USD/CHF trades at approximately 0.886, returning from the Fibonacci level.

USDCHF Technical Analysis
As for the technical indicators, the Stochastic Oscillator records show 90 in the description, meaning the Greenback is overpriced against the Swiss Franc. Furthermore, the RSI stepped below the overbought territory, indicating that the bear market is strengthening.
Despite the momentum indicators promising a price decline, the USD/CHF trend outlook remains bullish because the market is above the 100-period SMA.
Overall, the technical indicators suggest while the primary trend is bullish, the price can decline and consolidate near lower support levels.
USDCHF Price Forecast

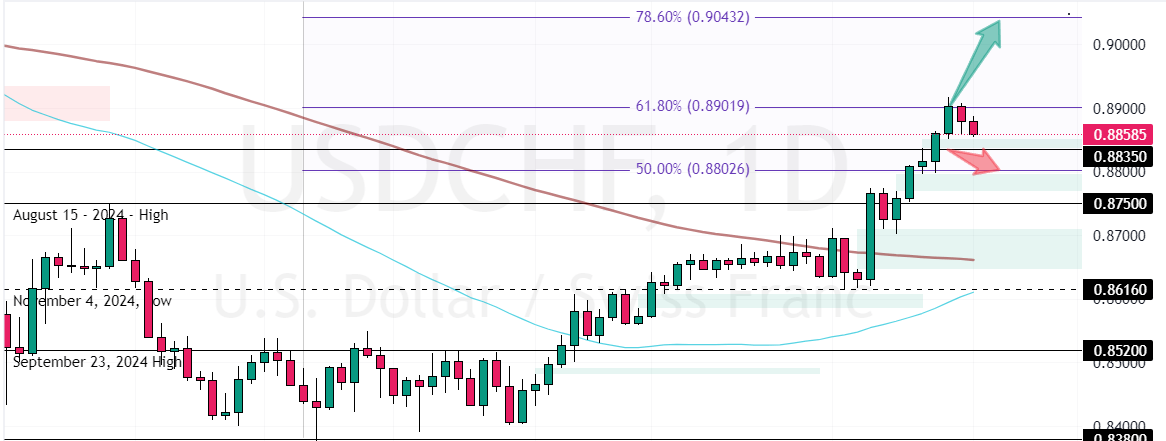
The immediate support is at 0.8835, backed by the bullish fair value gap area. From a technical perspective, today’s downtick momentum can potentially extend to the 50% Fibonacci level if the USD/CHF dips below the immediate support.
Furthermore, if selling pressure exceeds 0.8835, the next bearish target could be the August 15 high at 0.875.
Bullish Scenario
Conversely, if USD/CHF bulls pull the prices above the 61.8% Fibonacci level (0.890) and stabilize above it, a new bullish trend will likely begin, targeting the 78.6% Fibonacci at 0.904.
- Support: 0.8835 / 0.875 / 0.865
- Resistance: 0.890 / 0.904