...

What’s Next for Bitcoin After Dropping Below $71410?

FxNews—In the previous Bitcoin technical analysis (Bitcoin Hits 2024 High as Momentum Hints at Overbought), we stated that digital gold is overpriced because of the Stochastic Oscillator, and RSI 14 hovered over overbought territory then. Interestingly, the overbought condition resulted in the BTC/USD price dipping below $71.410, starting a new bearish wave from the October high of $73,860.

As of this writing, Bitcoin is trading at approximately $70,900. The 4-hour price chart below demonstrates the price, support, resistance levels, and technical indicators used in today’s analysis.
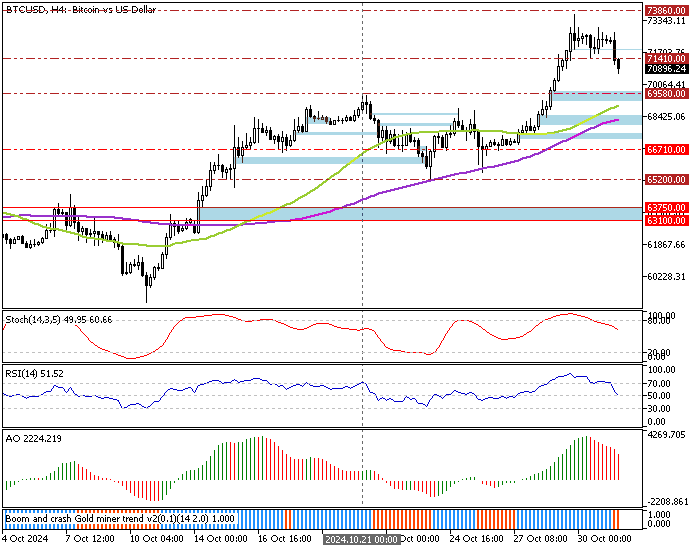
Bitcoin dipped below the immediate support level of $71,410, turning it into active resistance.
Bitcoin dipped below the immediate support level of $71,410, becoming active resistance.

Bitcoin Technical Analysis – 31-October-2024

The Stochastic Oscillator and RSI 14 are declining, recording 60 and 52 in the description, respectively. This decline means the bear market gains momentum while the trading security is not oversold, and the downtrend is likely to resume.

Furthermore, the Awesome Oscillator histogram is red, declining toward the signal line from above, meaning the uptrend weakens. On the other hand, the primary trend should be considered bullish because the price is above the 50- and 100-period simple moving averages.

Overall, the technical indicators suggest the primary trend is bullish, but the dip from $73,860 could be a consolidation phase. 

Bitcoin Price Forecast 31-October-2024
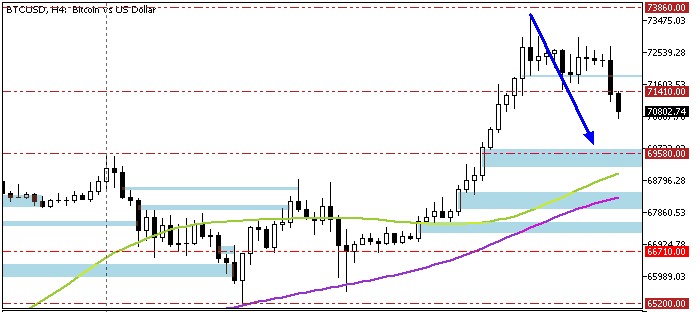
The support level at $69,580 provides a reasonable entry price for joining the bull market.

From a technical perspective, the current bearish momentum could extend to the $69,580 (October 21 high) if the BTC/USD price stays below the immediate resistance at approximately $71,410.

Please note that the $69,580 support is backed by the 50-period simple moving average and the Fair Value Gap area, making it a decent supply zone to join the bull market. Therefore, monitoring this level closely for bullish signals such as a long-wick candlestick pattern or a bullish- engulfing candlestick pattern is advisable.

Latest Posts

JSE Index Rises on Gold Miners and Rate Cut

On Friday, South Africa's JSE index climbed toward 85,700...

France Bond Yields Drop Amid Weak PMI Data

France's 10-year government bond yield has declined to 3%,...

Mexico GDP Surges 1.1% in Q3

Mexico's GDP grew by 1.1% in the quarter ending...

Chile Marks 3-Month High with 10.6% Price Rise

In October 2024, Chile's producer prices rose by 10.6%...

Indian Stock Market Soars on Positive Economic Signals

India's stock market experienced a significant boost on Friday,...

NATGAS Rises 5.4% Amid Cold Weather and Geopolitical Tensions

Over the past two days, natural gas prices in...

Crude Oil Prices Test $69.5 Amid Escalating Global Tensions

WTI crude oil futures rose to approximately $69.5 per...

Gold Surges Above $2650 as Russia-Ukraine War Escalates

Gold prices exceeded the 38.2% Fibonacci level, trading at...

Gas Prices Near Year High as Cold Snap Threatens Europe

Prices for European natural gas futures approached €47 per...

U.S. Gasoline Futures Hit Two-Week High at $2.05

Gasoline futures in the U.S. peaked at $2.05 per...

Silver Rally Halts at $31.4 Amid Solar Panel Surplus

FxNews—Silver prices eased to $30 per ounce as the...

Oil Prices Stable $69 as Geopolitical Risks Soar

FxNews—WTI crude oil futures remained above the $66.8 critical...

WTI Crude Dips to $68.5 as Norway Field Restarts

On Tuesday, WTI crude oil futures decreased to $68.5...