FxNews–The Silver price significantly jumped on Friday, May 17, closing the week at $31.4.
XAG/USD Overbought Bull Market Signals & Divergence

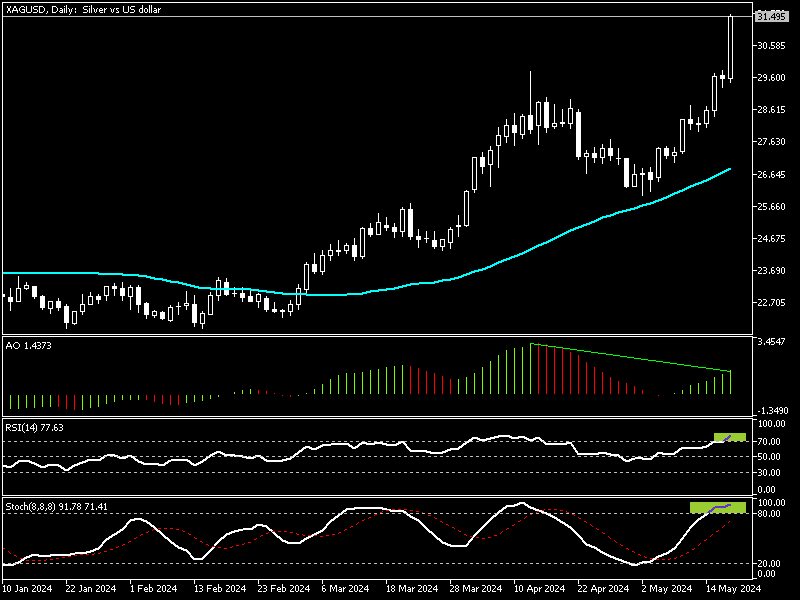
The Chart above shows the XAG/USD price action in the daily graph, where we highlighted the key technical signals in green.
The extreme uptrend momentum drove the relative strength index and the stochastic oscillator into the overbought area.
- RSI value in the Daily Chart: 77.6
- Stochastic value in the Daily Chart: 91.7
In addition to the momentum indicators, the awesome oscillator shows a divergence in its green bars, backing the uptrend by exhibiting 77.6 in the description.
These developments in the technical indicators mean the XAG/USD is an overbought bull market. It is noteworthy that it is not suggested to join a bull market when it is saturated with buying pressure. We zoom into the Silver 4-Hour chart to find key levels and potential entry points.
Silver Technical Analysis – 4-Hour Chart

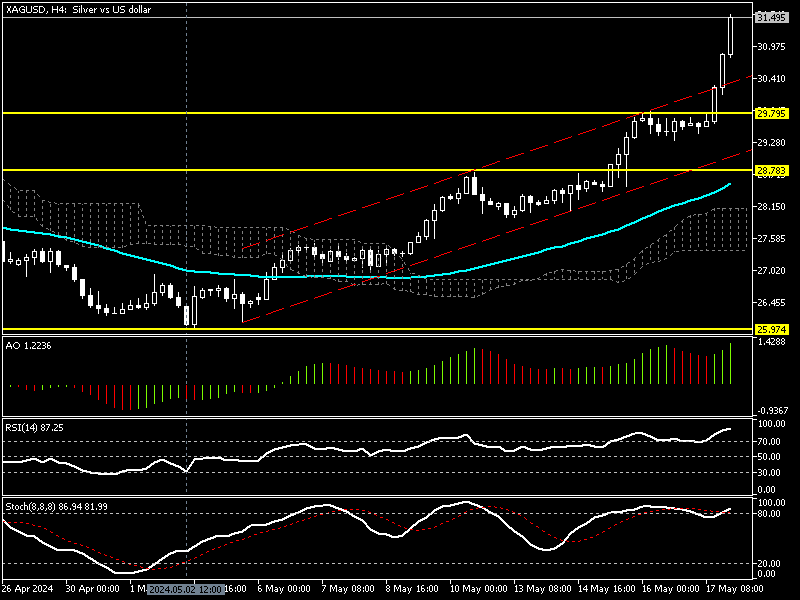
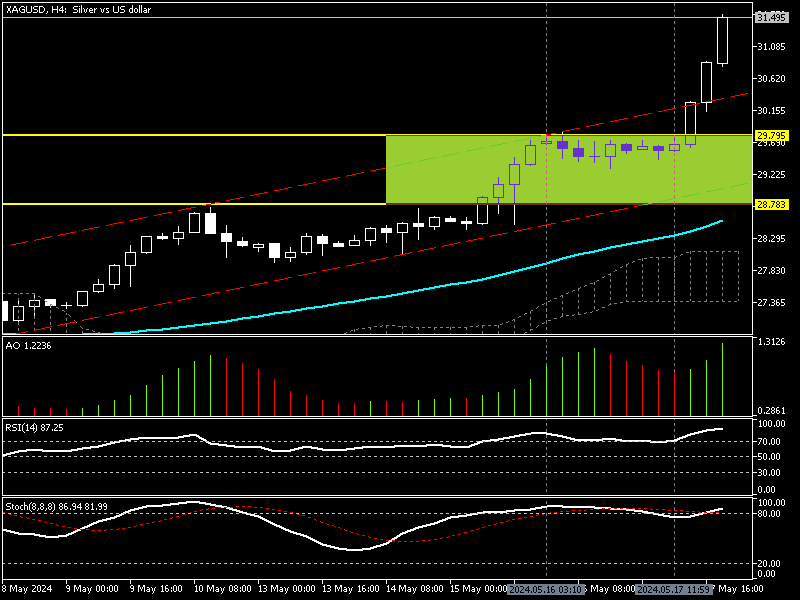
The image above demonstrates that the uptick momentum significantly increased after the price broke out from the bullish channel and the $29.7 resistance. This barrier was holding back further growth for 24 hours only, a resistance that couldn’t last long against the buying pressure.
The technical indicators in the 4-hour Chart signal an overbought condition. The RSI value is 87, and the stochastic oscillator recorded 86.9. These developments suggest waiting patiently for the U.S. Dollar to erase some recent losses against Silver.
Why $29.7 is Key for Silver Investors

If Silver starts a consolidation phase, the exchange rate could dip to $29.7, and the $31.4 peak will be considered the new higher high. The resistance level in discussion offers a decent bid to join the bull market compared to Silver’s current price of $31.4, which is very expensive and overpriced.
Analysts at FxNews advise monitoring the key resistance levels below for bullish candlestick patterns, such as long-wick bullish candlestick or hammer candlestick patterns, before gradually increasing buying bids. Candlestick patterns are a traditional and recommended strategy for finding new highs and lows in any market.
- Resistance 1: $29.7
- Resistance 2: $28.7
The Bearish Scenario
The EMA 50 and Ichimoku Cloud stand between the bull and the bear market. The uptrend should be invalidated if the XAG/USD price falls below EMA 50 or Ichimoku Cloud. This support level is about $28.7. If this scenario comes into play, the drop could extend to the May 2 low of around $25.