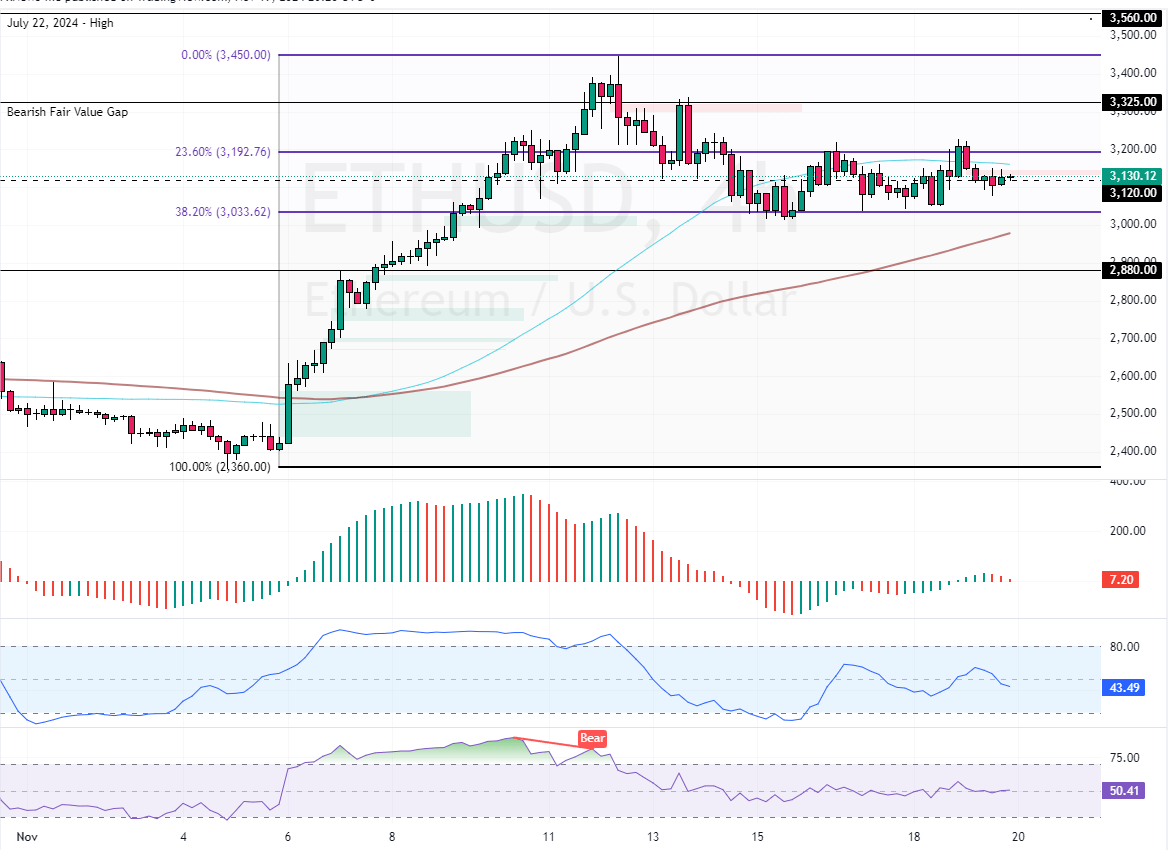
FxNews—Ethereum trades bullishly above the 100-period simple moving average. However, ETH buyers failed to stabilize the prices above the 23.6% Fibonacci retracement level. As a result, the cryptocurrency pair in discussion began trading sideways, consolidating above the 38.2% Fibonacci level.

Ethereum Technical Analysis
As for the technical indicators, they suggest the market lacks momentum, backing the sideways momentum.
- The Awesome Oscillator bars are red and cling to the signal line with small bars.
- RSI 15 moves alongside the median line, meaning the market is not bullish nor bearish.
- The Stochastic flipped below the median line, suggesting ETH/USD is mildly bearish.
The immediate resistance is at the 23.6% Fibonacci level ($3,190). From a technical perspective, the uptrend will likely resume if bulls stabilize the prices above the immediate resistance. The next bullish target in this scenario could be the 3,325 mark, followed by $3,450.
On the other hand, the consolidation phase could extend to the 2,880 mark if bears push the Ethereum prices below the immediate support at $3,033.
- Support: 3,033 / 2,880
- Resistance: 3,190 / 3,325 / 3,450