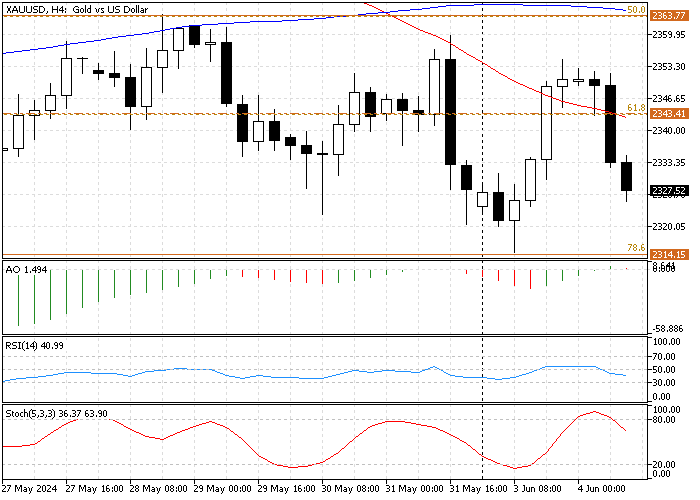
Gold has been trading sideways since May 24. The XAU/USD constantly tested the 50% Fibonacci retracement level at $2,363 at the top and the 78.6% Fibonacci at $2,314 at the bottom. As of writing, the yellow metal trades at about $2,320, below SMA 50 and SMA 100.
The Gold daily chart below demonstrates the Fibonacci levels, simple moving averages, and other key technical tools.

XAUUSD Technical Analysis – 4-June-2024
The primary trend of gold is bullish, but this precious metal has been consolidating since the price hit its $2,450 peak on May 20.
The technical indicators provide the following information:
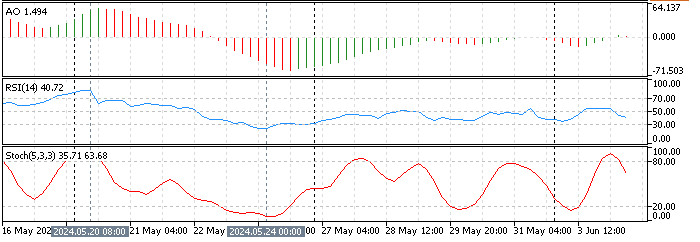
- The awesome oscillator bars are small and close to the zero line, which indicates that the Gold market doesn’t have a significant trend. It is neither bullish nor bearish at the moment.
- The Relative strength index value is declining, recording 40 in the description. This decrease in the RSI 14 value interprets that the market has bearish tendencies.
- The Stochastic line crossed below the overbought territory, depicting 35 in the %K line, which suggests that the market is turning bearish.

These developments in the gold 4-hor chart suggest the market is moving sideways but is mildly tilted toward a downtrend.
Gold Price Forecast – 4-June-2024

The critical resistance level is at %50 Fibonacci level at $2,363, a level neighboring the SMA 100. The price is below 61.8% Fibonacci, marching gradually toward the key support at %78.6 at $2,314. Technical instruments suggest the $2,314 mark will likely be targeted again.
That said, if the selling pressure exceeds the key support at $2,314, the decline that began on May 20 will likely extend to test the $2,277 significant support area. If this scenario unfolds, the SMA 50 and 100 will play the resistance role.
Bullish Scenario
As mentioned earlier, gold’s primary trend is bullish. For the uptrend to resume, the bulls must cross above the key resistance level at $2,363, backed by SMA 100 and %50 Fibonacci. Should this occur, the next bullish target could be the 38.2% Fibonacci at $2,384, followed by 23.6% Fibonacci at $2,409.
If this scenario occurs, the 50% Fibonacci level will support the bullish outlook.
Gold Key Support and Resistance Levels
Traders and investors should closely monitor the key levels below to make informed decisions and adjust their strategies accordingly as market conditions shift.
- Support: $2,314 / $2,277
- Resistance: $2,343 / $2,363 / $2,384
Disclaimer: This technical analysis is for informational purposes only. Past performance is not necessarily indicative of future results. Foreign exchange trading carries significant risks and may not be suitable for all investors. Always conduct your research before making any investment decisions.