FxNews—Gold is in a robust bull market. In today’s trading session, it traded at approximately $2,650, consolidating from the $2,685, which is the 2024 all-time high.
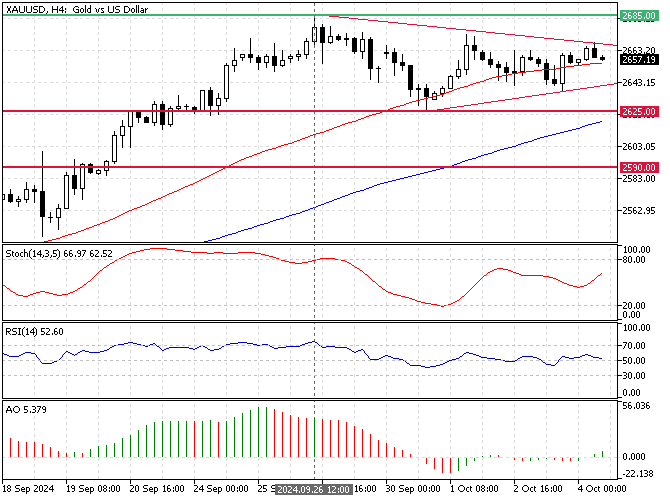
Currently, Gold’s price moves inside a symmetrical triangle, closing the apex above the 50-period simple moving average. The 4-hour chart below demonstrates the price, support, resistance levels, and technical indicators used in today’s analysis.

XAUUSD Technical Analysis – Gold Consolidates at $2650
The primary trend is bullish because the XAU/USD price is above the 50- and 100-period simple moving averages. Additionally, the Awesome oscillator stepped above the signal line with a green histogram, meaning the bull market prevails.

The momentum indicators, RSI 14, and Stochastic oscillator are away from overbought territory, depicting 53 and 67 in the description. This means Gold is not saturated from buying, and the price can potentially rise.
Overall, the technical indicators suggest the primary trend is bullish and should resume.
Gold Price Forecast – 4-October-2024
The immediate resistance rests at the September 26 high of $2,685. If bulls (buyers) close and stabilize the Gold price above $2,685, the next bullish target could be the psychological level of $3,000.
Please note that the bull market should be invalidated if the XAU/USD conversion rate falls below the 100-period simple moving average, which is at approximately $2,625.
XAU/USD Support and Resistance Levels – 4-October-2024
Traders and investors should closely monitor the key levels below to make informed decisions and adjust their strategies accordingly as market conditions shift.
- Support: $2,625 / $2,590
- Resistance: $2,685 / $3,000