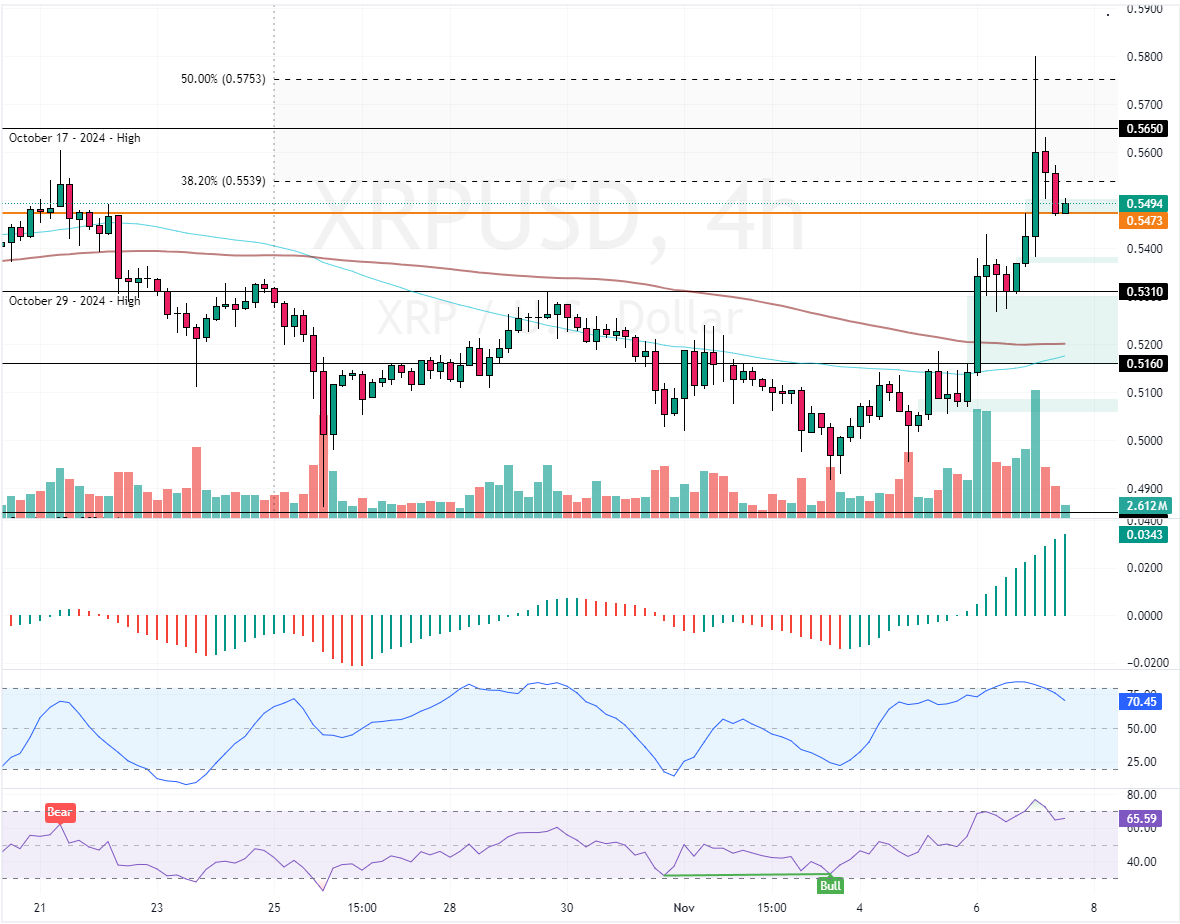
FxNews—Ripple‘s bullish bias was short-lived, as the price turned downward after it peaked at the %50 Fibonacci retracement level at $0.575. As of this writing, XRP returned below the October 17 high (active resistance), trading at approximately $0.548.

Ripple (XRP) Technical Analysis – 7-November-2024
Zooming into the 4-hour chart, we notice that the Stochastic Oscillator and the RSI 14 were overbought territory, justifying today’s bearish bias. But Ripple (XRP) lost 1.1 percent of its value today, which is more than other major cryptocurrencies.
As of this writing, XRP is filling the Fair Value Gap at approximately $0.547, a critical support level that held the prices to dip further. From a technical perspective, if bears push the price below $0.547, the downtrend will likely be triggered again. The next bearish target in this scenario could be revisiting the $0.531 support (October 29 High).
- Next read: Ripple Tests Key Resistance After %3.7 Gain
Bullish Scenario
Conversely, the primary bullish trend would resume if XRP holds above $0.547 and exceeds the immediate resistance at $0.553 (38.2% Fibonacci retracement level). If this scenario unfolds, the next bullish target could be $0.565 (October 17 high).
- Support: 0.531 / 0.516 / 0.5
- Resistance: 0.553 / 0.565 / 0.575

J.J Edwards is a finance expert with 15+ years in forex, hedge funds, trading systems, and market analysis.

