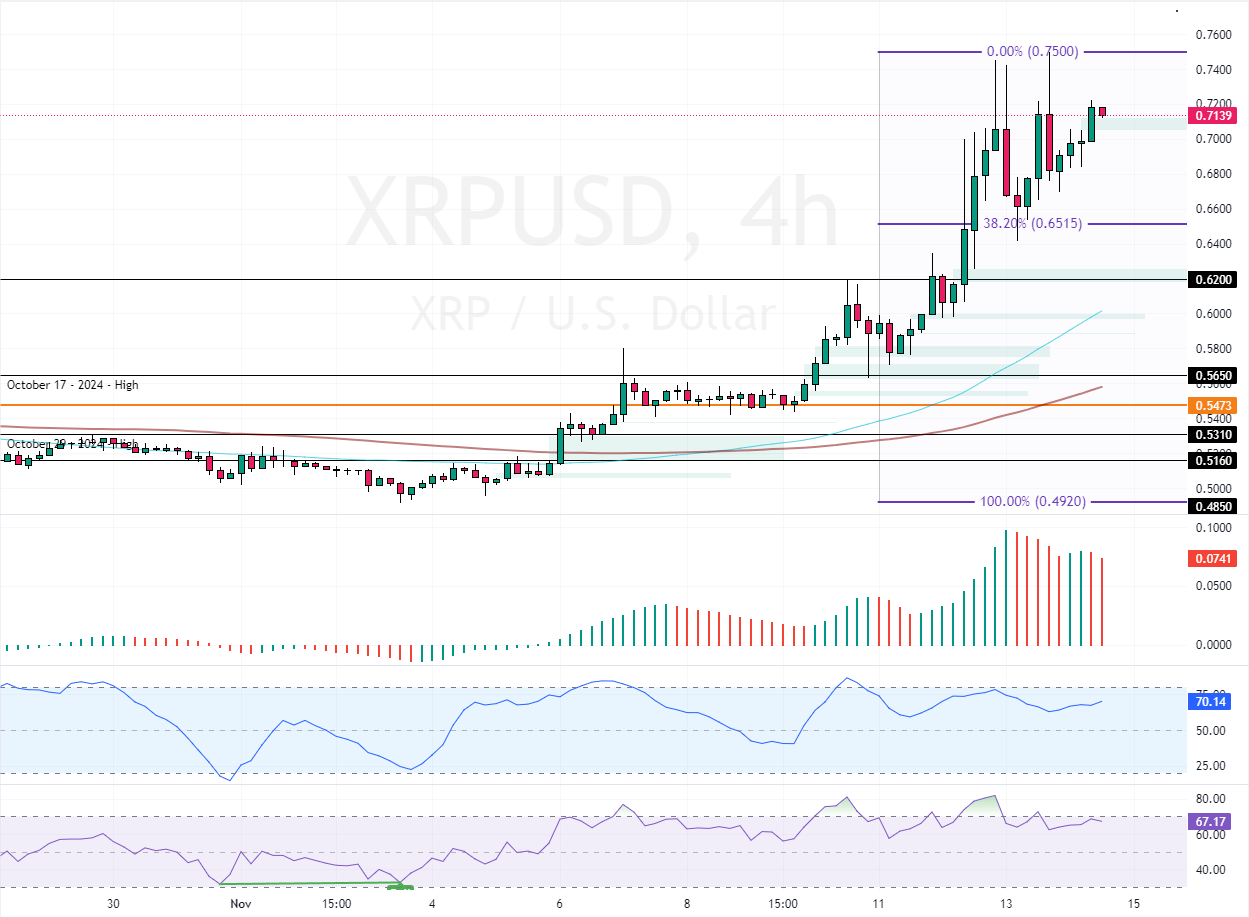
FxNews—Ripple (XRP) began its bullish trajectory from the 38.2% Fibonacci retracement level ($0.651). As of this writing, XRP trades at approximately $0.713, aiming toward the November 13 high ($0.75).

Ripple (XRP) Technical Analysis
The outlook of the XRP/USD remains bullish as long as the prices are above the 38.2 Fibonacci. As for the technical indicators, the RSI and Stochastic depict 67 and 70 in the description, meaning the market is not overbought.
However, the Awesome Oscillator’s bars turned red while above the zero line, indicating the bull market weakened.
Overall, the technical indicators suggest the primary trend is bullish but the Ripple prices could move sideways for a while before a new trend emerges.
XRP Could Hit $1 If Bulls Secure Above $0.75
The XRP immediate resistance is at $0.75. From a technical perspective, the uptrend should resume if bulls close and stabilize XRP prices above this resistance. In this scenario, the next bullish target could be the $1.0 physiological level.
- Also read: Solana Bull Run Hinges on Key $198 Level
Please note that the bullish outlook should be invalidated if the Ripple (XRP) value falls below the 38.2% Fibonacci ($0.651). If this scenario unfolds, a new bearish wave will likely emerge, which could extend to $0.62.
- Support: 0.651 / 0.62
- Resistance: 0.75 / 1.0