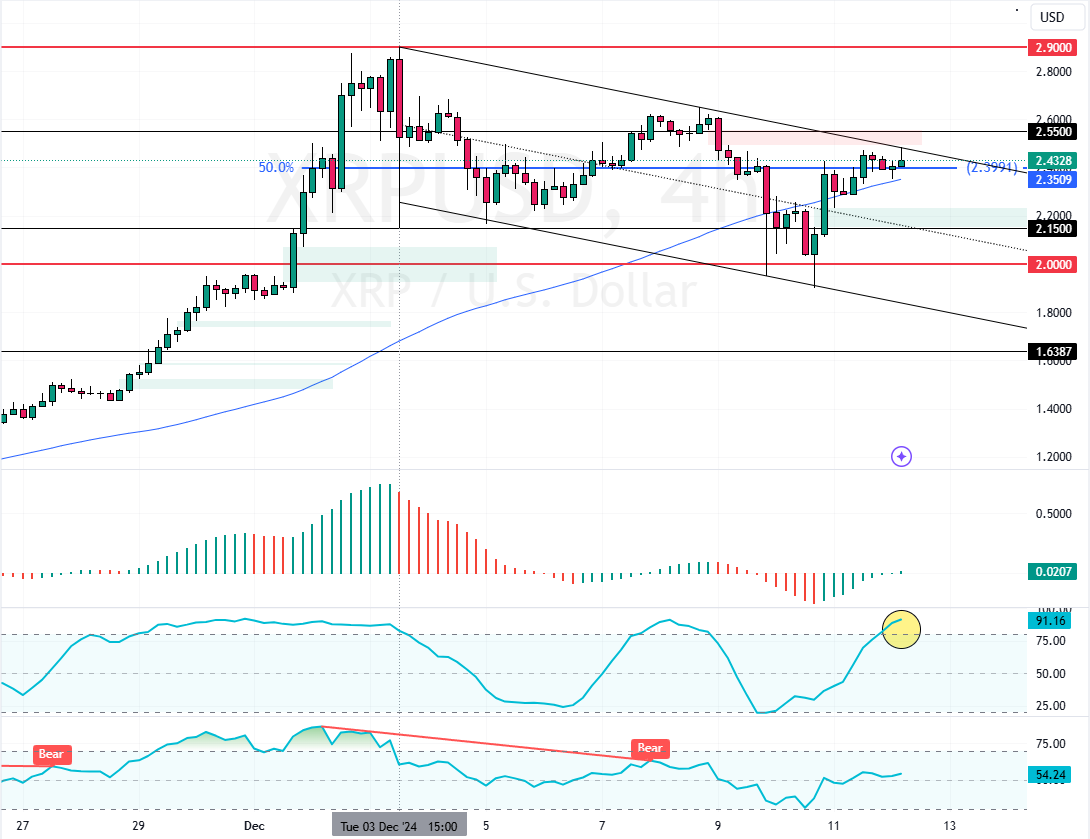
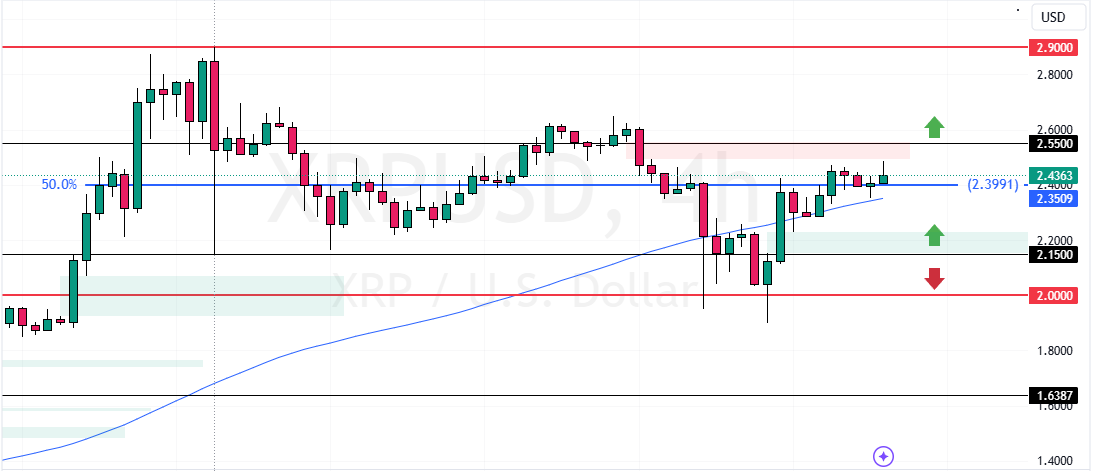
FxNews—XRP or Ripple began its bullish trend from the $2.0 psychological level. However, the uptrend slowed after the cryptocurrency reached the %50.0 Fibonacci resistance level at $2.4. Please note that this resistance is backed by the descending trendline, making it a prominent barrier for the bulls.
As of this writing, XRP/USD trades at approximately $2.43.

Ripple Technical Analysis – 12-December-2024
The XRP’s trend outlook should be bullish because the prices are above the 75-period simple moving average, backed by Awesome Oscillator’s green bars, which just flipped above zero.
However, the Stochastic Oscillator shows 91 in the description, meaning Ripple is overpriced in the short term.
Overall, the technical indicators suggest that while the primary trend is bullish, the XRP/USD trend could lose momentum or reverse from this point.
XRP Hits Barrier at $2.4: What’s Next?

The XRP/USD’s immediate support is $2.15, backed by the bullish fair value gap. Additionally, the immediate resistance is at $2.55.
Now that the key support and resistance are set, from a technical perspective, the uptrend will likely resume if XRP’s value exceeds $2.55. The next bullish target in this scenario could be the December 3 High at $2.90.
- Next good read: Ethereum Slows At $4000: Adjust Your Bullish Strategy
The Bearish Scenario
On the other hand, a new bearish wave could emerge if bears (sellers) push XRP below the $2.15 mark. If this scenario unfolds, the price could decline toward the $2.0 psychological level.