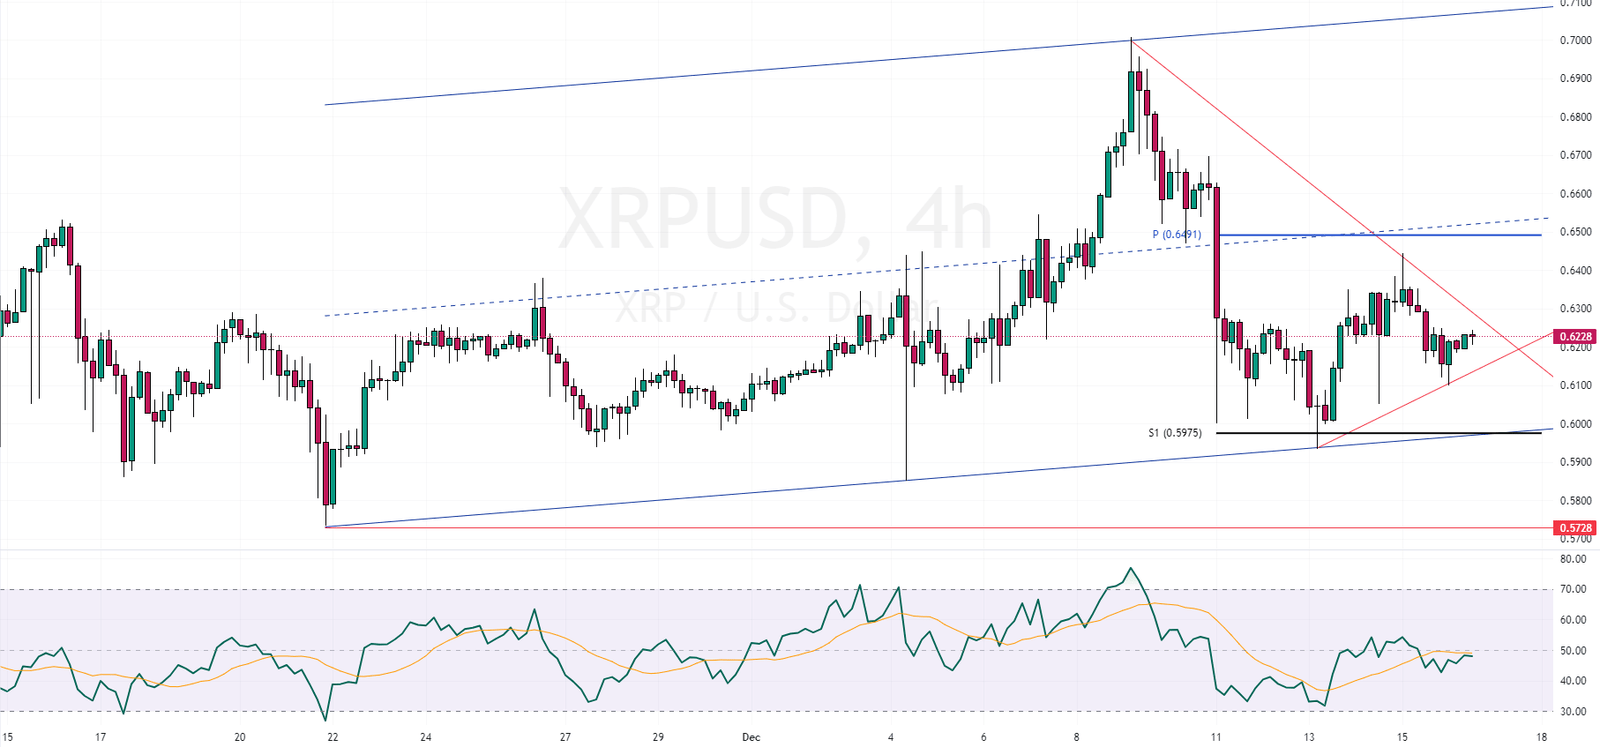
FxNews XRPUSD analysis – Currently, the exchange rate of Ripple (XRP) to the US dollar stands at 0.622.
XRPUSD Analysis – Critical Trading Patterns
A closer examination of the 4-hour XRPUSD chart reveals that the pair is trapped in a wedge triangle pattern, indicating a crucial juncture. The Relative Strength Index (RSI), an essential market sentiment indicator, is hovering around the 50 level, signifying a state of uncertainty within the market.
Further analysis of the XRPUSD 4-hour chart shows the pair trending within a broad bullish channel. This pattern suggests that the pair might be gearing up for an upward movement. If the trend continues in this direction, there’s a strong likelihood that the pair could rise and approach the 0.6491 pivot point. However, for this significant shift to occur, it’s crucial for the bulls to successfully break above the wedge pattern, marking their initial step in this potential upward journey.

XRPUSD Analysis: The Bearish Scenario
On the other hand, the resistance level, marked as R1, serves as a key support zone. The lower boundary of the bearish flag pattern further strengthens this area. If the bears manage to break through this line, it could signal a shift in market dynamics, placing more downward pressure on Ripple. In such a scenario, we might witness a decline in the value of XRP, potentially reaching as low as 0.5728.